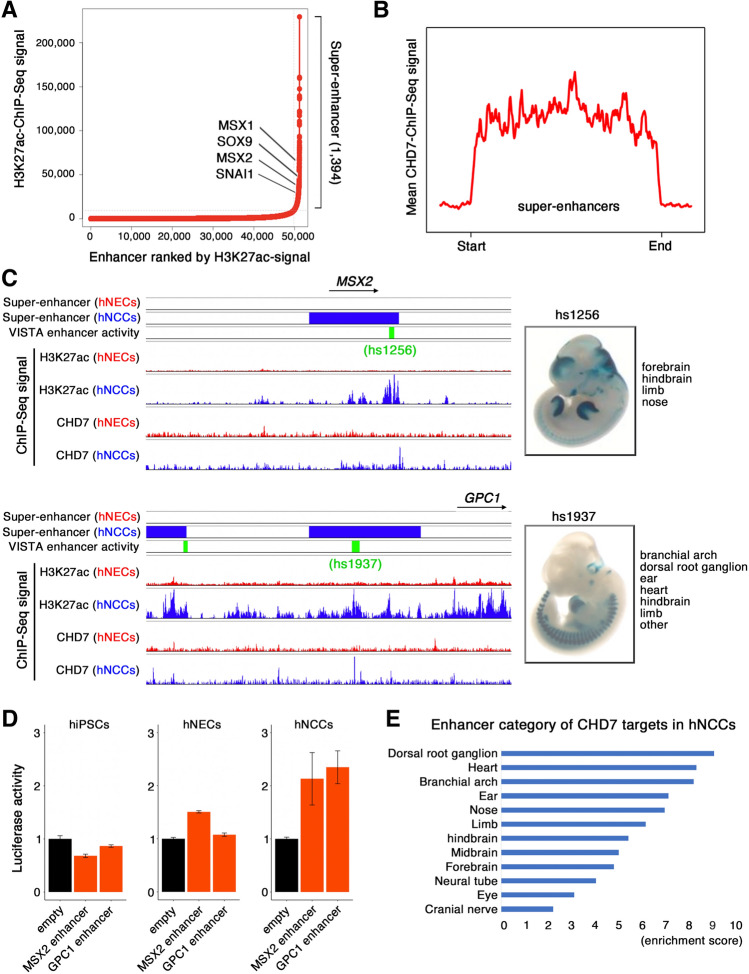
Figure 3.
CHD7 bound to SE regions with TFAP2A and NR2F1/2. (A) Distribution of H3K27ac ChIP-seq density at enhancers in increasing order of input-normalized H3K27ac ChIP-seq signal. Enhancers above the curve’s inflection point are considered SEs. The respective ranks of SEs and their associated genes are shown. (B) Density plots of mean CHD7 ChIP-seq signals across SEs in hNCCs. (C) Snapshots showing combined tracks of SEs (red; hNEC, blue; hNCC), VISTA enhancer activity (green), and ChIP-seq data (α-H3K27ac and α-CHD7) near MSX2 and GPC1. Images on right are screenshots of tissue-specific activities of the enhancer proximal to MSX2 and GPC1 tested in a lacZ reporter transgenic mouse assay extracted from the VISTA Enhancer Browser database (https://enhancer.lbl.gov/). (D) A luciferase reporter assay was performed to determine the activity of CHD7-bound enhancers near MSX2 and GPC1. Reporter plasmid (empty control, MSX2 enhancer, and GPC1 enhancer) was transfected to hiPSCs, hNECs, and hNCCs to compare enhancer activity. Renilla reporter was co-transfected for normalization (F/R ratio). Y axis shows fold enrichment over an empty control. Data are presented as the mean ± SEM. (E) Functional analysis of genomic regions of CHD7-bound regions intersected with enhancer regions validated in the VISTA Enhancer Browser database in hNCCs. Bar plot showing enrichment of enhancer occupancy across 16 different tissues.

