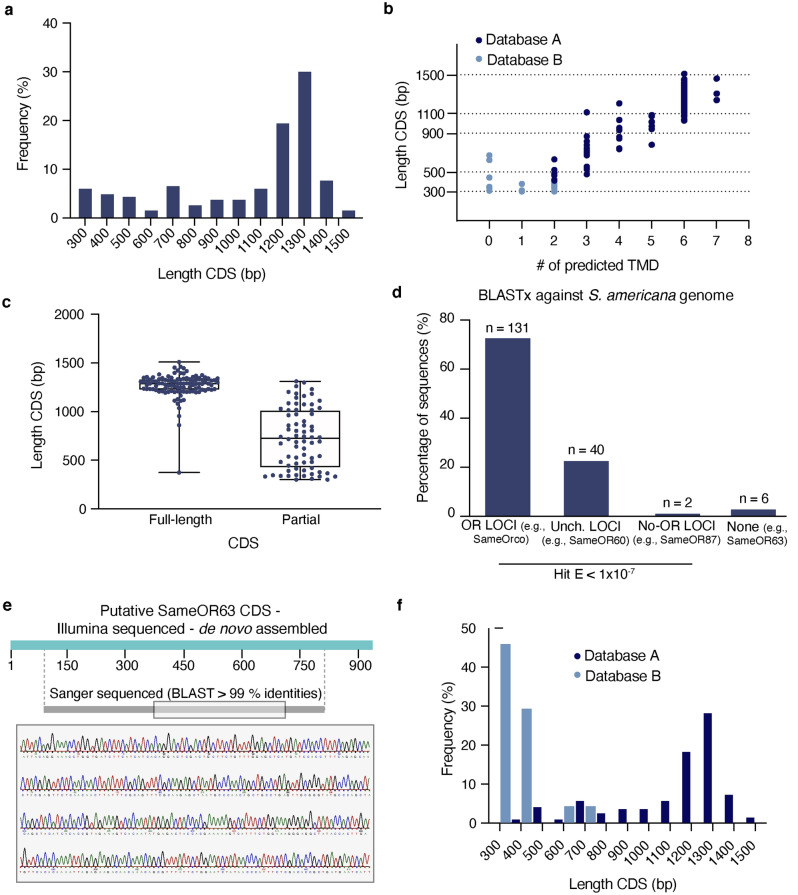
Figure 1.
Statistical characterization of SameORs identified in the unified transcriptome assembly. (a) Frequency distribution of CDS length (bp). (b) Relation between CDS length and number of TMDs predicted from the deduced amino acid sequences of the 179 putative ORs. Putative OR sequences were divided into database A (dark blue) and database B (light blue) for further analysis. (c) Length of full and partial CDSs. (d) Blastx results of putative SameOR CDSs against a recently posted S. americana genome assembly. Shown are the percentage of sequences with a significant match (E < 1E−7) to either a predicted OR, an uncharacterized (Unch.) or a none-OR loci, and those that did not match any genomic region (None). (e) Schematic highlighting of SameOR63 CDS region amplified by RT-PCR and sequenced using Sanger. The Sanger chromatogram at the bottom is an example of the sequencing results. (f) Frequency distributions of CDS length in Database A (dark blue) and Database B (light blue).

