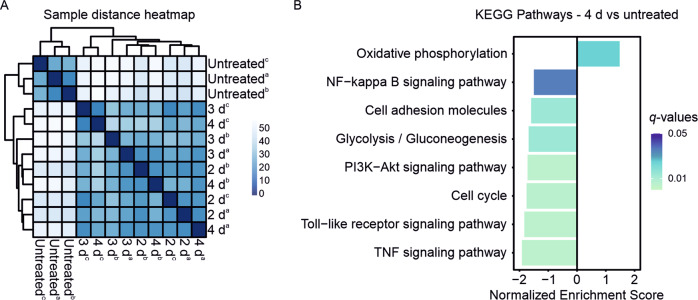
Fig. 1. RNA-seq of REC-1 during ibrutinib treatment.
A Heatmap showing sample-to-sample distances of untreated and ibrutinib-treated (2 d, 3 d, 4 d) samples of three independent replicates (a, b, c) based on the variance stabilizing transformed values. B Selected significant pathways (|log2FC | ≥ 1, q-value < 0.05) of 4 d ibrutinib-treated REC-1 (vs untreated) from Kyoto Encyclopedia of Genes and Genomes (KEGG) pathway gene set enrichment analysis (GSEA).

