Figure 2.

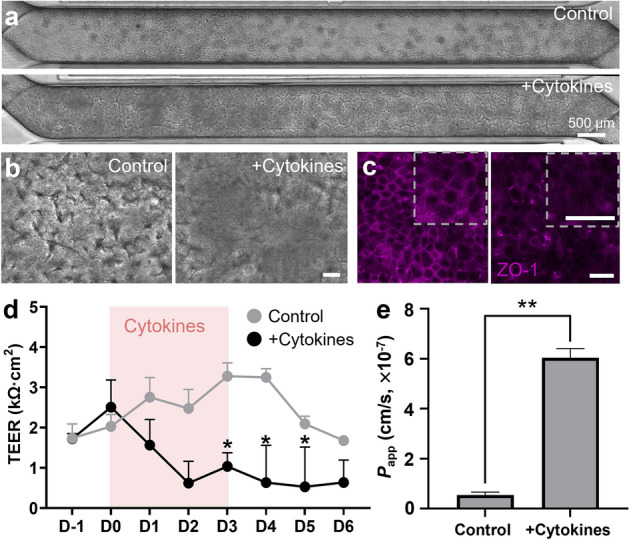
The recreation of a leaky epithelial layer in a Leaky Gut Chip. (a) The stitched phase-contrast views of epithelial layers across the entire microchannel in the absence (Control) or the presence of a cytokine cocktail (+ Cytokines; 100 ng/mL TNF-α and 100 ng/mL IL-1β) taken on day 3 (D3) since the cytokine treatment. (b) High-power magnification of epithelial morphology visualized by DIC microscopy in the absence (Control) or the presence of a cytokine cocktail (+ Cytokines). (c) Immunofluorescence micrographs that highlight ZO-1 in the absence (Control) or the presence of a cytokine cocktail (+ Cytokines). An inset (a dashed square) in each panel shows a high-power magnification of the part of the provided immunofluorescence image. (d) The profile of epithelial barrier function quantitated by TEER measurement as a function of time in the absence (Control; n = 5) or the presence of a cytokine cocktail (+ Cytokines; n = 6). A pink box in the chart illustrates the period of cytokine treatment for 72 h. *p < 0.05. (e) Apparent permeability (Papp) calculated by the fluorescein transport assay across the epithelial interface in a Leaky Gut Chip without (Control) or with a cytokine mixture (+ Cytokines). **p < 0.01. Bars are 50 µm, unless otherwise indicated.
