Figure 3.
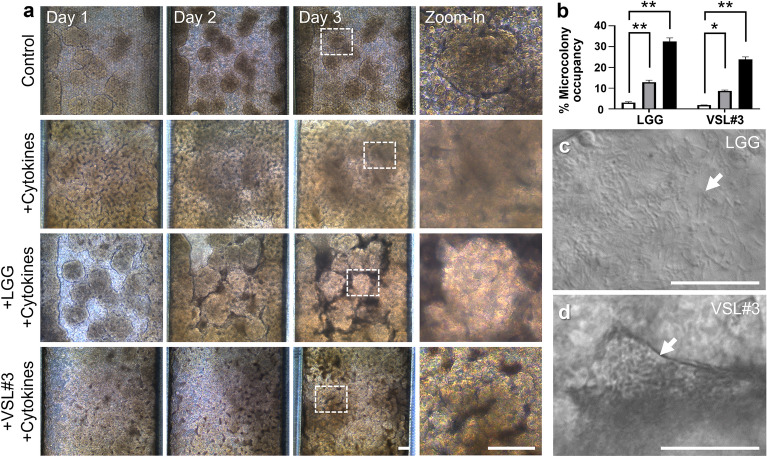
Morphological monitoring of the epithelial cells co-cultured with probiotic bacteria in a Leaky Gut Chip. (a) Phase-contrast micrographs of the morphological changes of epithelium challenged to a cytokine cocktail followed by the co-cultures with live LGG (+ LGG + Cytokines) and VSL#3 cells (+ VSL#3 + Cytokines) on days 1, 2, and 3. The image at “zoom-in” was enlarged from the location indicated in a dashed box in Day 3. (b) Quantification of the colonized area by either LGG or VSL#3 cells (% Microcolony occupancy) on the cytokine-challenged epithelium for 3 days (n = 3 per chip). The white, grey, and black columns indicate day 1, 2, and 3, respectively. A snapshot with a high-power magnification of LGG (c) or VSL#3 cells (d) co-cultured on a leaky epithelium. The DIC micrographs in (c) and (d) were captured from the real-time videos taken on Day 3 of the co-cultures provided in Supplementary Video S1 (LGG) and S2 (VSL#3), respectively. An arrow indicates the location of a microcolony. Bars, 50 µm. *p < 0.05, **p < 0.01.

