Figure 4.
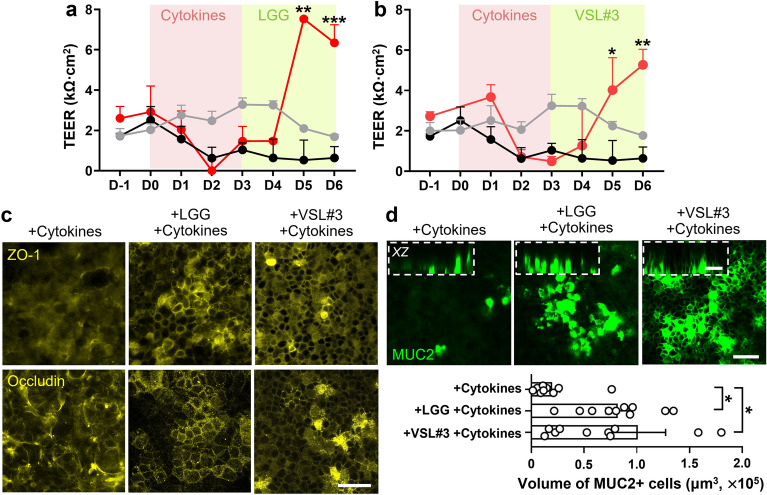
Restoration of impaired epithelial barrier when co-cultured with probiotic bacteria in a Leaky Gut Chip. The profile of epithelial barrier function measured by TEER when LGG (a) or VSL#3 bacterial cells (b) were co-cultured (red) in the cytokine-challenged Leaky Gut Chip compared to the cultures with cytokine challenges without probiotic co-cultures (black) or no cytokine challenges (grey). The pink and light green boxes indicate the period of the cytokine treatment and the probiotic co-culture, respectively. Cytokine treatment ceased during the probiotic co-cultures. The TEER profile of the Control and the Cytokine treated groups were replicated from Fig. 2d. *p < 0.05, **p < 0.01, ***p < 0.001. (c) Immunofluorescence visualization of the localization of ZO-1 and occludin in Leaky Gut Chips stimulated with probiotic bacteria (+ LGG + Cytokines or + VSL#3 + Cytokines) or germ-free controls without probiotic stimulation (+ Cytokines). Bar, 50 μm. (d) Immunofluorescence confocal micrographs of epithelial cells that highlight the expression of MUC2 before (+ Cytokines) and after a probiotic co-culture with either LGG (+ LGG + Cytokines) or VSL#3 (+ VSL#3 + Cytokines) in a Leaky Gut Chip. An inset in a dashed box shows a cross-sectional vertical view (XZ) in the same chip analyzed. A bar chart displays the quantification of MUC2-positive cells in volumes as a function of probiotic co-cultures. *p < 0.05. Bars, 50 μm.

