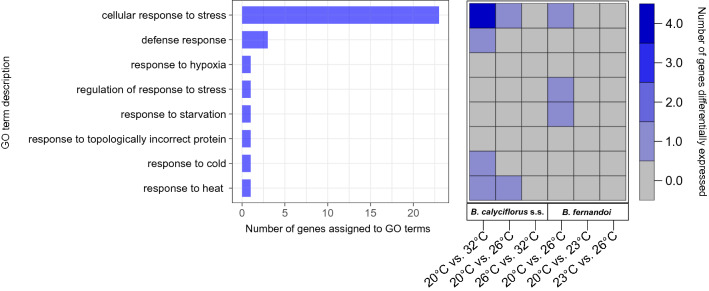
Figure 1.
Annotation and differential expression of genes inferred to be under positive selection. Bar plot shows the genes which were assigned to the term GO:0006950 (response to stress). Bars represent the number genes assigned to one of the child terms of GO:0006950. More than one GO term can be assigned to the same gene. The heatmap shows the number of genes differentially expressed in each GO term category in B. calyciflorus s.s. and B. fernandoi under different temperatures regimes35.

