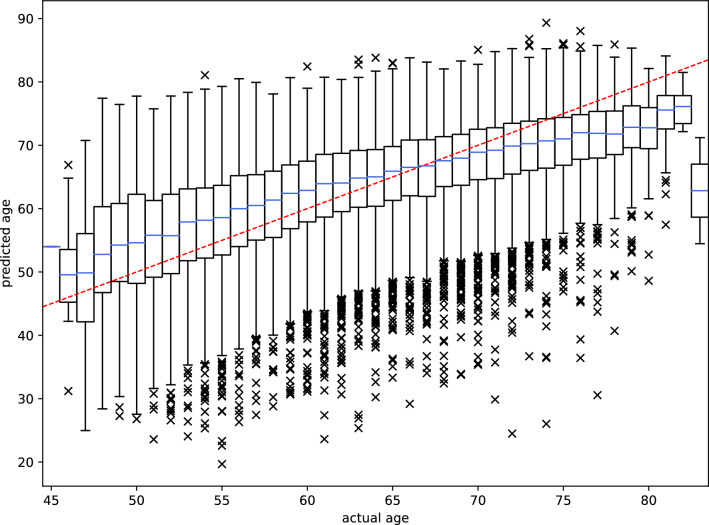
Figure 1.
ECG-derived age vs. chronological age for 36,349 participants of the UKB. The Pearson correlation coefficient was 0.53. The red dashed line illustrates a perfect fit. Data is grouped into boxes as the chronological age at the time of recording the ECG was only available as the number of years. Note that ranges and scales are different between the x- and y-axis due to outliers in the predicted age being considerably outside the range of the chronological age in the cohort. Box plot features: blue centre lines, median; box limits, first and third quartile; whiskers, inter-quartile range; markers, outliers.

