
Figure 2.
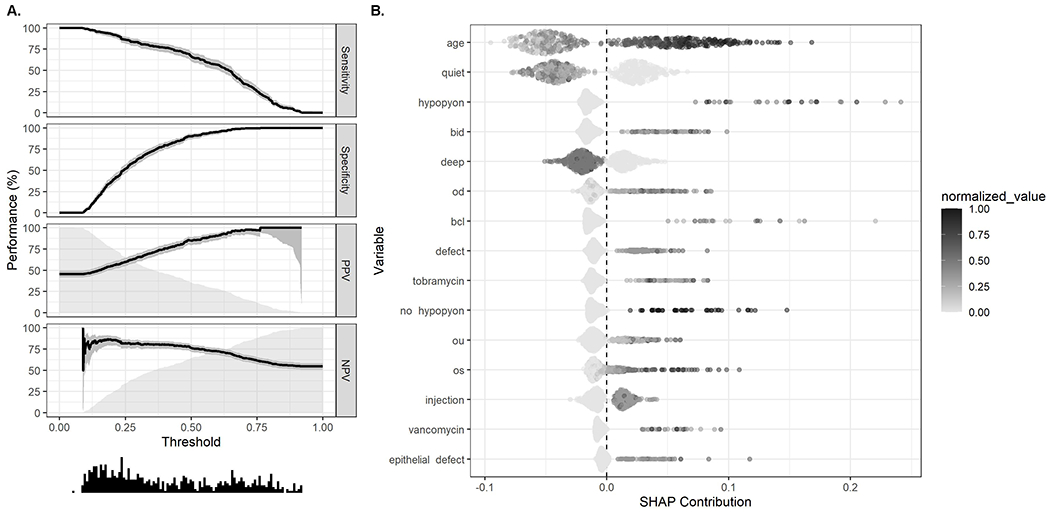
A. Performance plot showing diagnostics for random forest model predictions of presenting visual acuity of <20/40 for the affected eye of unilateral infections or better eye for patients with bilateral infections. Performance statistics (sensitivity, specificity, positive predictive value [PPV], negative predictive value [NPV]) are plotted with 95% confidence intervals (shaded areas around lines) and a histogram (bottom) displays the distribution of predicted values. B. Shapley plot displaying variable importance and effect from random forest models predicting presenting visual acuity of <20/40 for the affected eye of unilateral infections or better eye for patients with bilateral infections. All variables were normalized to be on the same scale (0-1) for display purposes. SHAP contribution (SHapley Additive exPlanations) refers to the contribution each variable from each observation has on prediction. BID, twice daily; OD, right eye; BCL, bandage contact lens; OU, bilateral; OS, left eye.