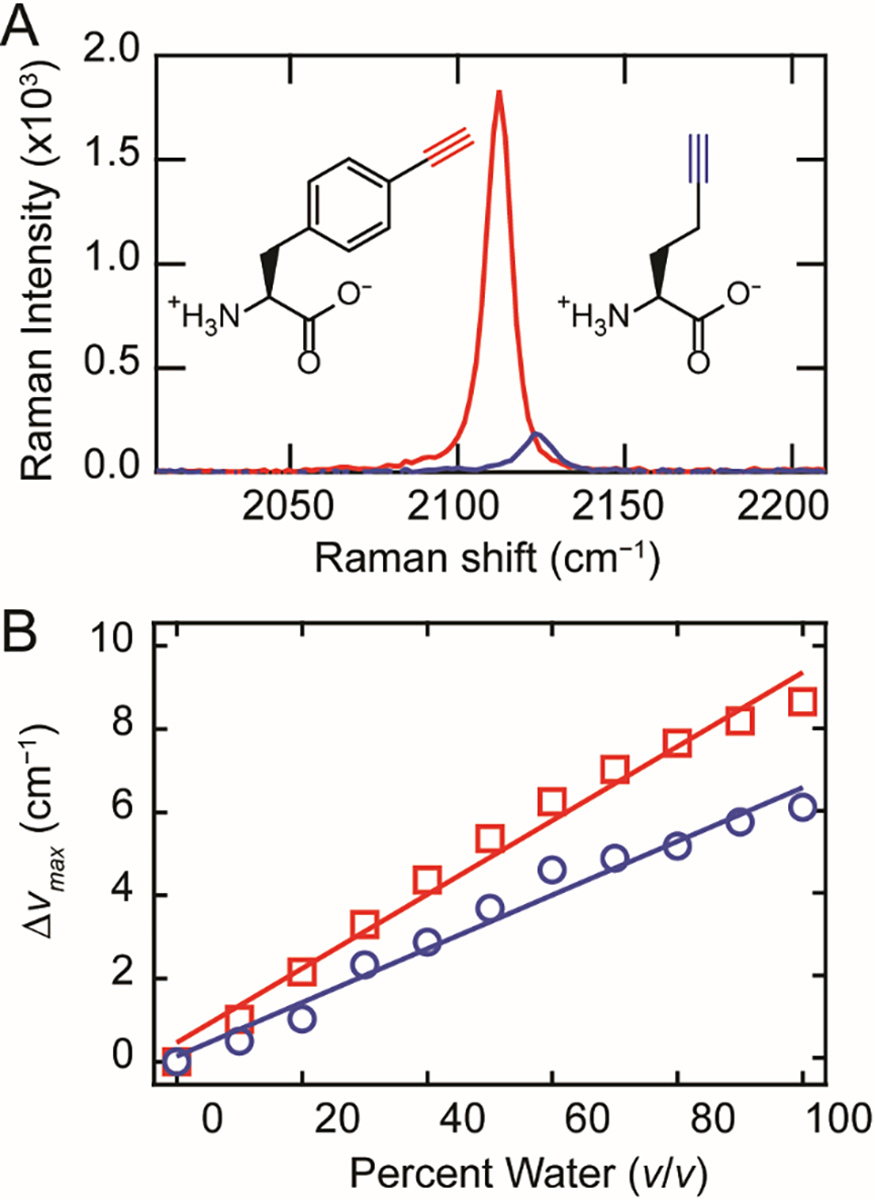
Figure 2.

Comparison between FCC and HPG. (A) The C≡C stretching bands of FCC (red) and HPG (blue) in phosphate buffer (10 mM in 20 mM sodium phosphate, 100 mM NaCl, pH 7.4). Structures of HPG and FCC are also shown. (B) The change in the C≡C stretching peak intensity (Δνmax) from 100% DMSO to 100% phosphate buffer for FCC (red squares) and HPG (blue circles). Linear fits to the data are included as a visual guide.
