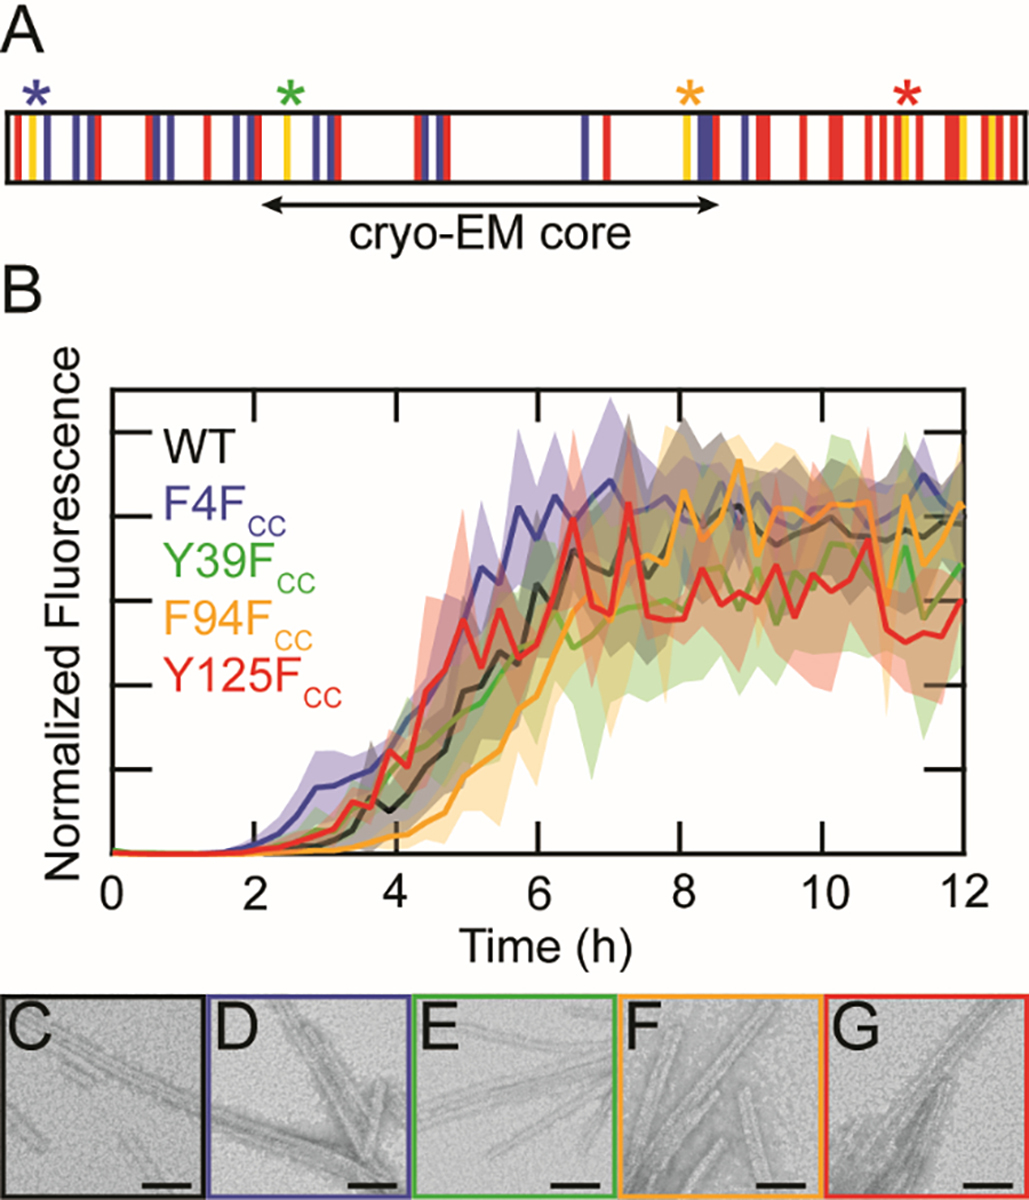
Figure 3.

Substitution of FCC at native aromatic sites is minimally perturbative to α-syn fibril formation. (A) Schematic representation of the α-syn primary sequence. Basic, acidic and aromatic residues are shown in blue, red, and yellow, respectively. The β-sheet structured core determined by cryo-EM is indicated. Sites of FCC incorporation (4, 39, 94 and 125) are marked with asterisks. (B) ThT-monitored aggregation kinetics of WT (black), F4FCC (blue), Y39FCC (green), F94FCC (orange), and Y125FCC (red). Solid lines represent averages with shaded areas indicating the standard deviation (n = 3). Proteins were aggregated at 25 μM in 20 mM sodium acetate, 50 mM NaCl, pH 5.0 at 37 °C with shaking. Data from individual wells were normalized to the maximum fluorescence value before averaging. TEM images of (C) WT, (D) F4FCC (E) Y39FCC (F) F94FCC, and (G) Y125FCC taken 40 h post-aggregation. Scale bars are 50 nm.
