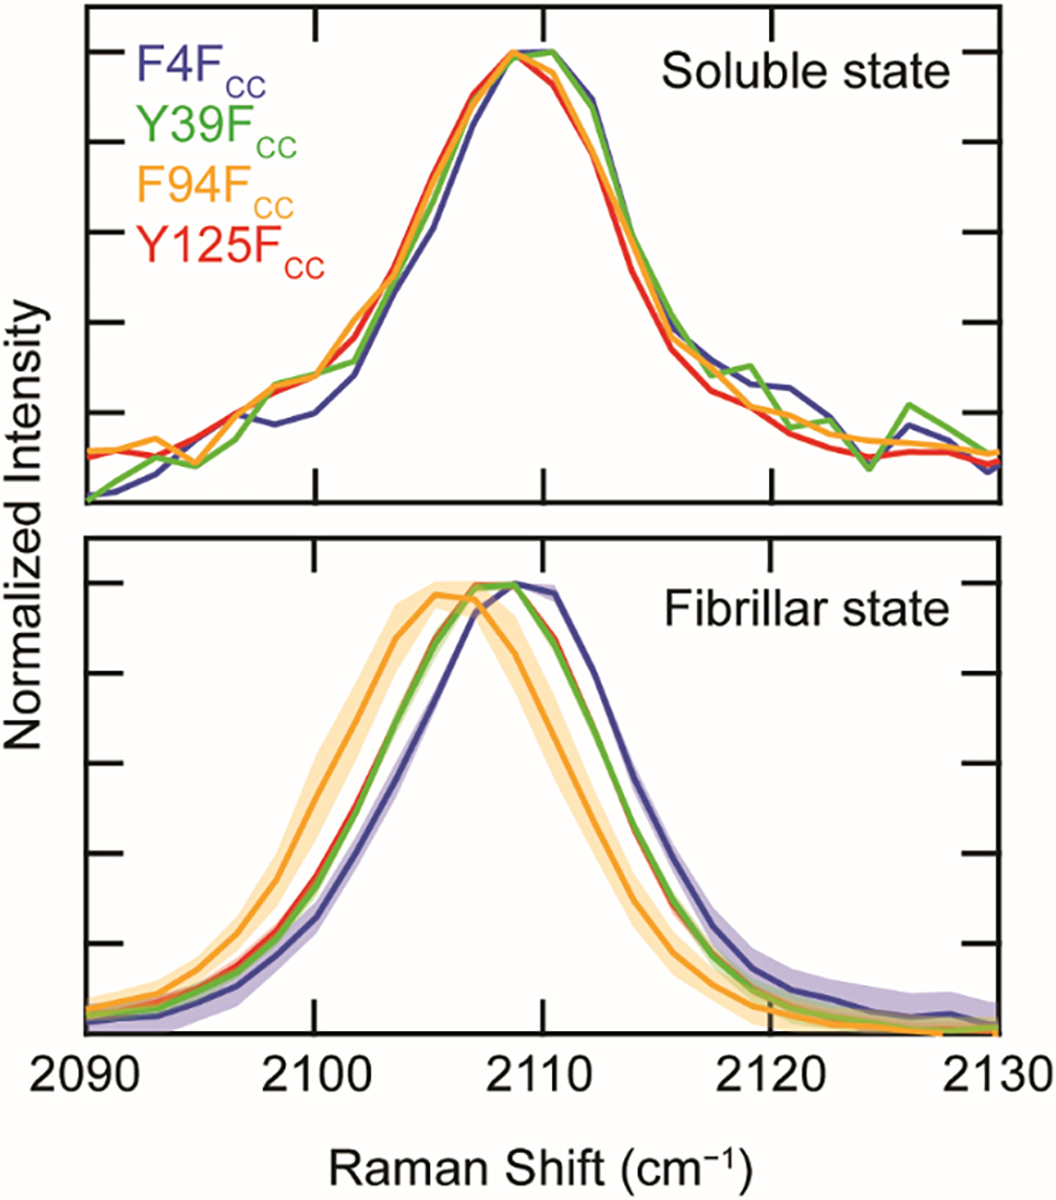
Figure 4.

The C≡C stretching band of FCC-α-syn mutants in soluble vs. fibrillar state. Spectra of proteins (F4FCC (blue), Y39FCC (green), F94FCC (orange), and Y125FCC (red)) collected prior to (top panel) and following aggregation (bottom panel) ([α-syn] = 300 μM in 20 mM sodium acetate, 50 mM NaCl, pH 5.0). Note that the fibrillar spectra of Y125FCC and Y39FCC overlay. For fibrillar spectra, solid lines represent averages across multiple aggregates with shaded areas indicating the standard deviation (n = 8). All spectra are normalized to the peak intensity of the C≡C stretching band.
