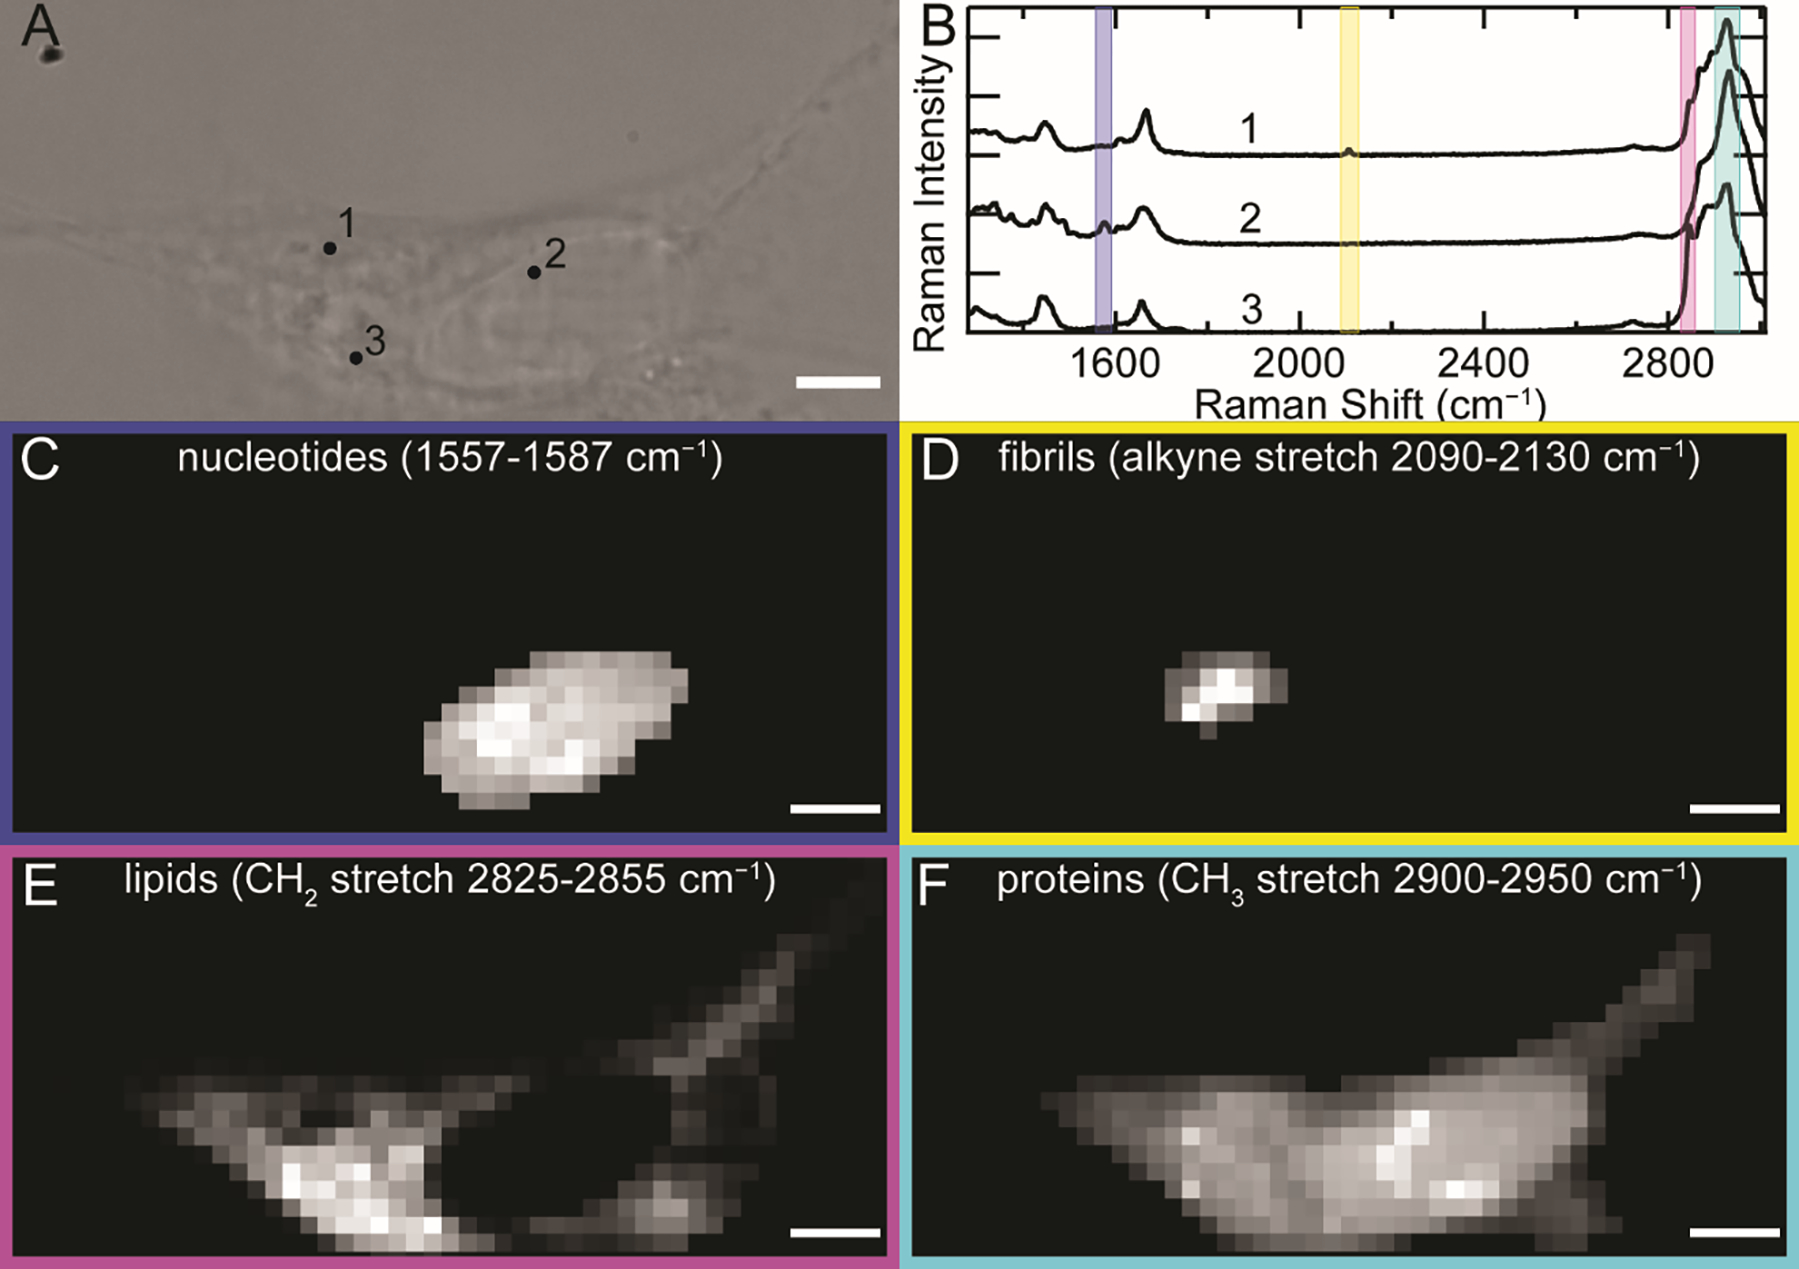
Figure 5.

The FCC C≡C stretch unambiguously reports on the localization of F94FCC fibrils uptaken by SH-SY5Y cells. (A) BF image of an SH-SY5Y cell treated with 0.5 μM F94FCC fibrils for 48 h. (B) Raman spectra collected (6 × 1 s accumulation time) at the corresponding numbers in (A). Colored boxes represent spectral regions of nucleotide ring breathing (blue, 1557–1587 cm−1), FCC C≡C stretching (yellow, 2090–2130 cm−1), methylene (magenta, 2825–2855 cm−1) and methyl (cyan, 2900–2950 cm−1) C–H stretching modes. Corresponding Raman maps generated by integration over the different spectral regions representing (C) nucleotides, (D) FCC-containing fibrils, (E) lipids, and (F) proteins as indicated. Scale bars are 5 μm.
