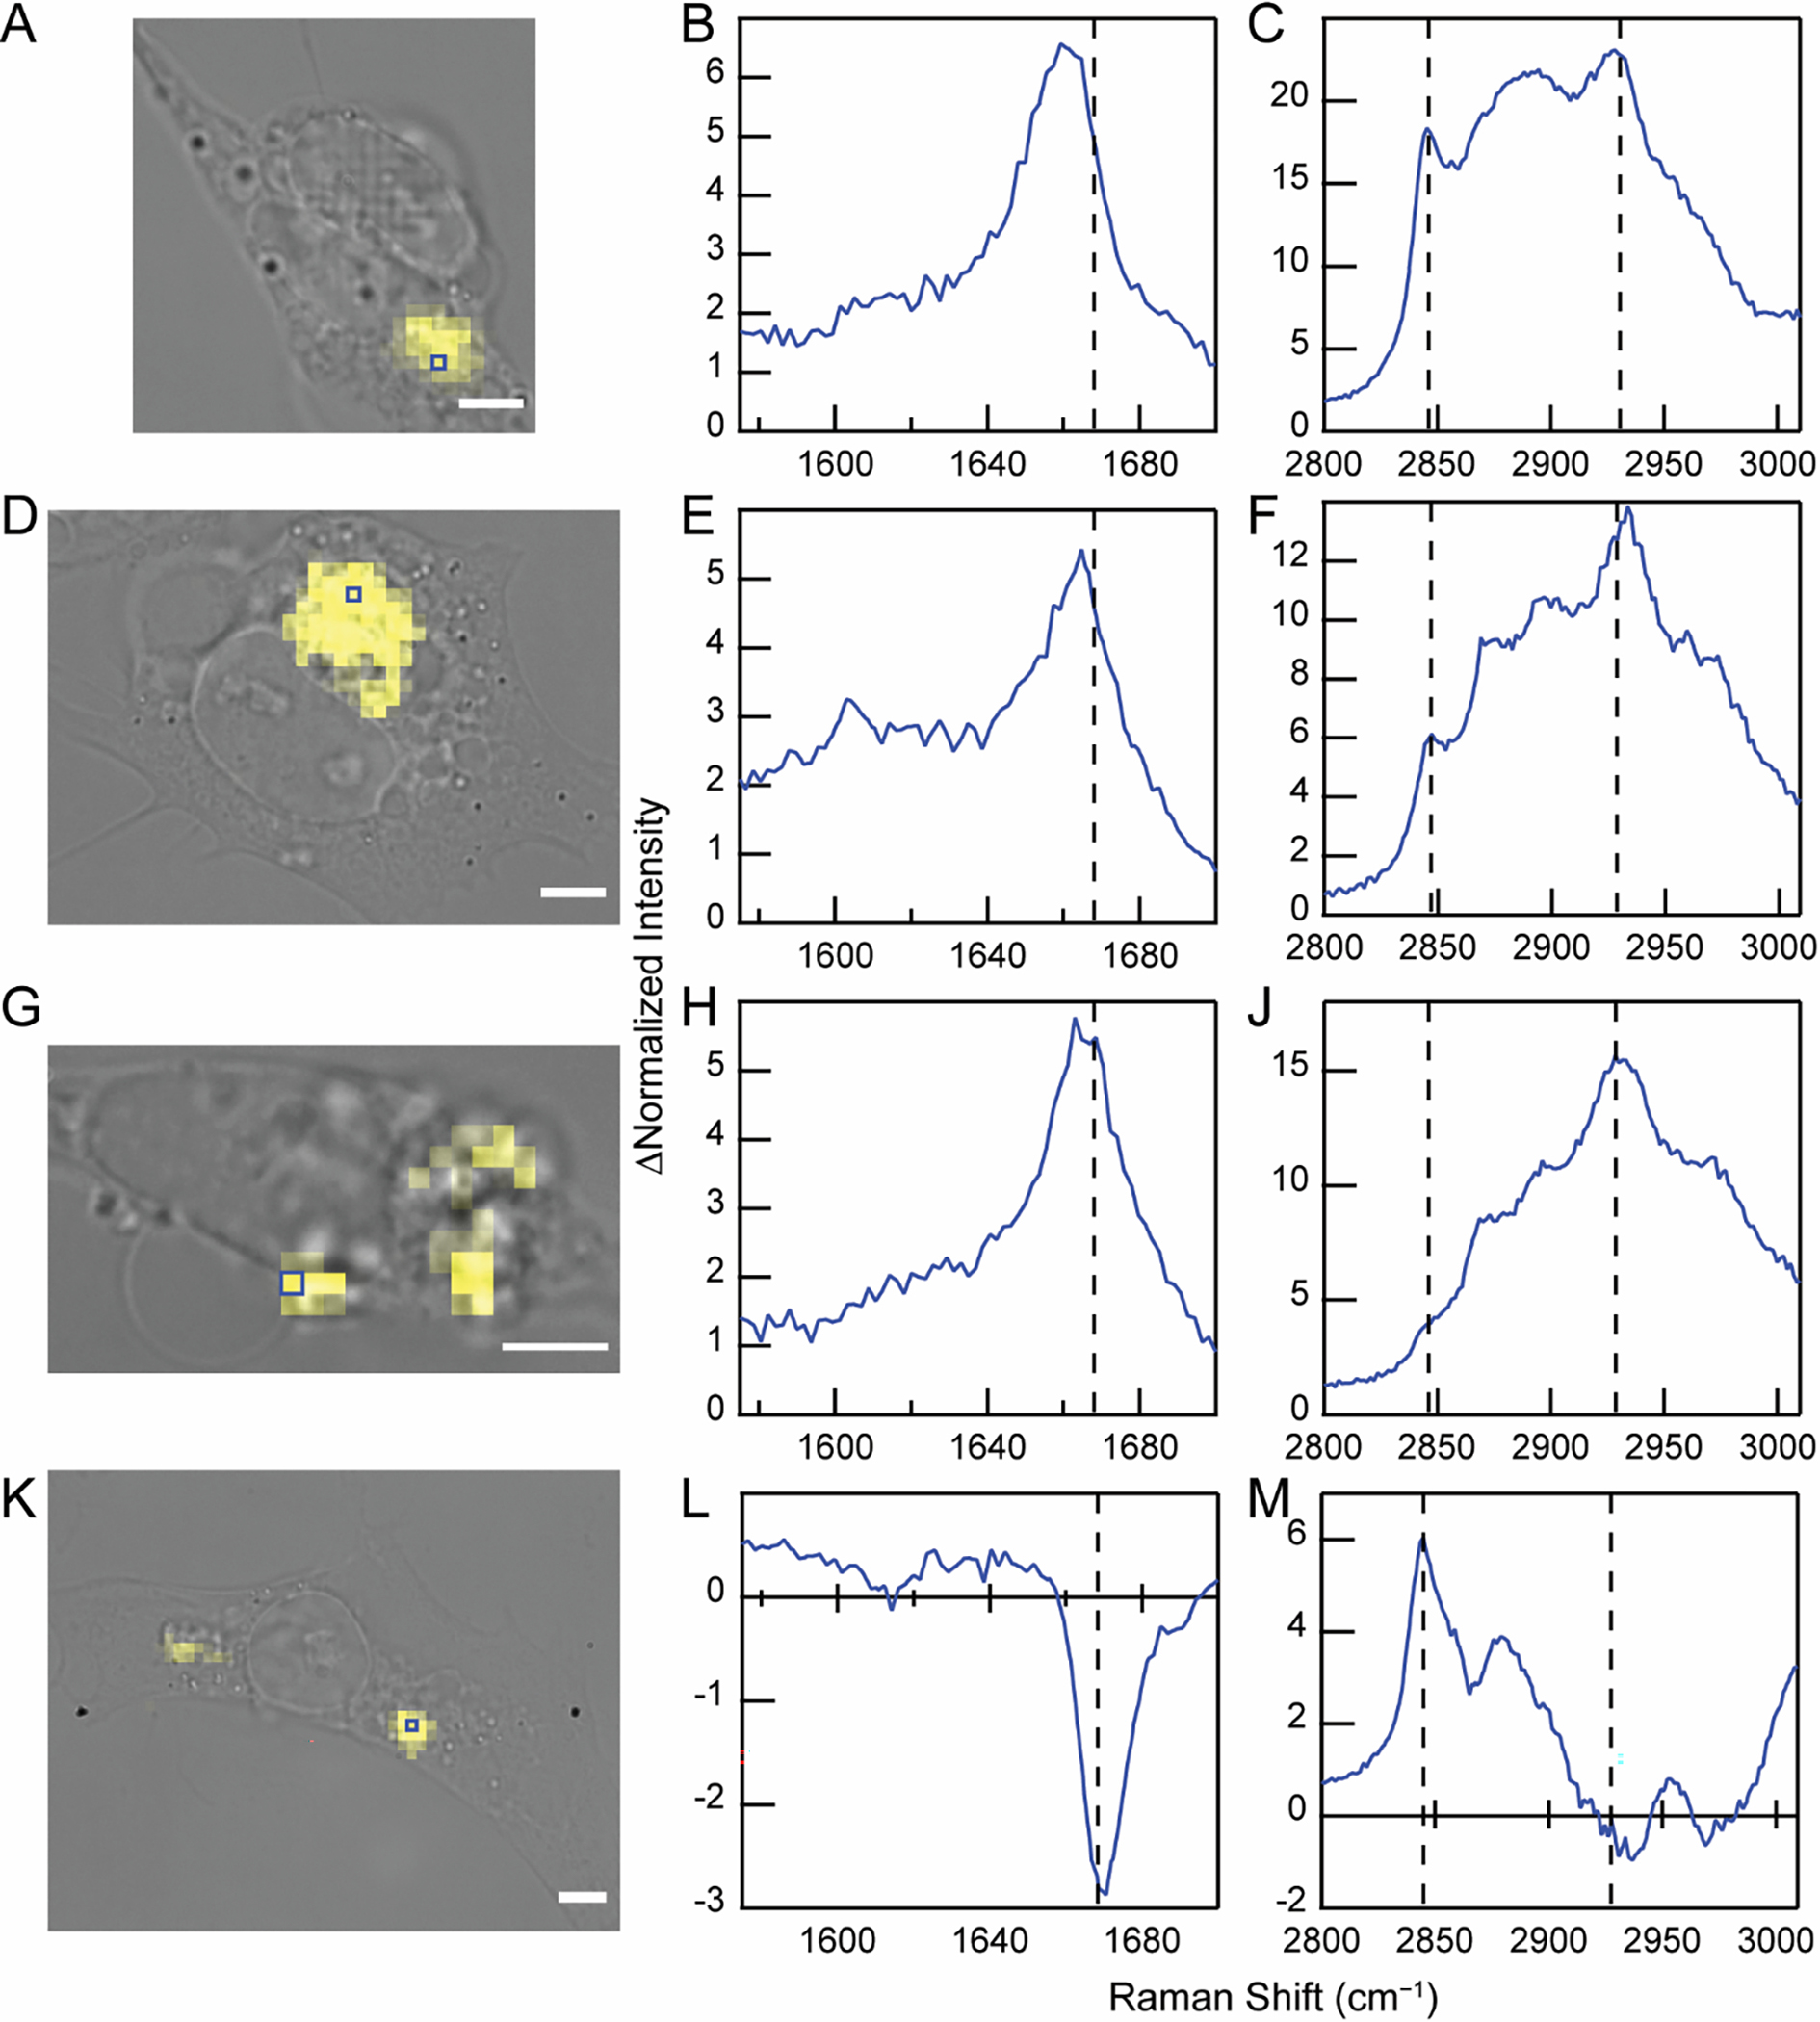
Figure 7.

Internalized FCC fibrils from different cells exhibit distinct spectral features. BF image of SH-SY5Y cells treated with F94FCC fibrils (0.5 μM) overlaid with the Raman map generated from C≡C stretching band in yellow (A, D, G, and K). Scale bars are 5 μm. Blue boxes indicate the location of individual pixels where difference spectra were obtained. The amide-I (B, E, H, and L) and C–H stretching (C, F, J, and M) regions are shown. The dashed lines serve as guides for comparison. Corresponding spectra can be found in Figure S5. Similar data analysis for internalized Y39FCC fibrils is shown in Figure S6.
