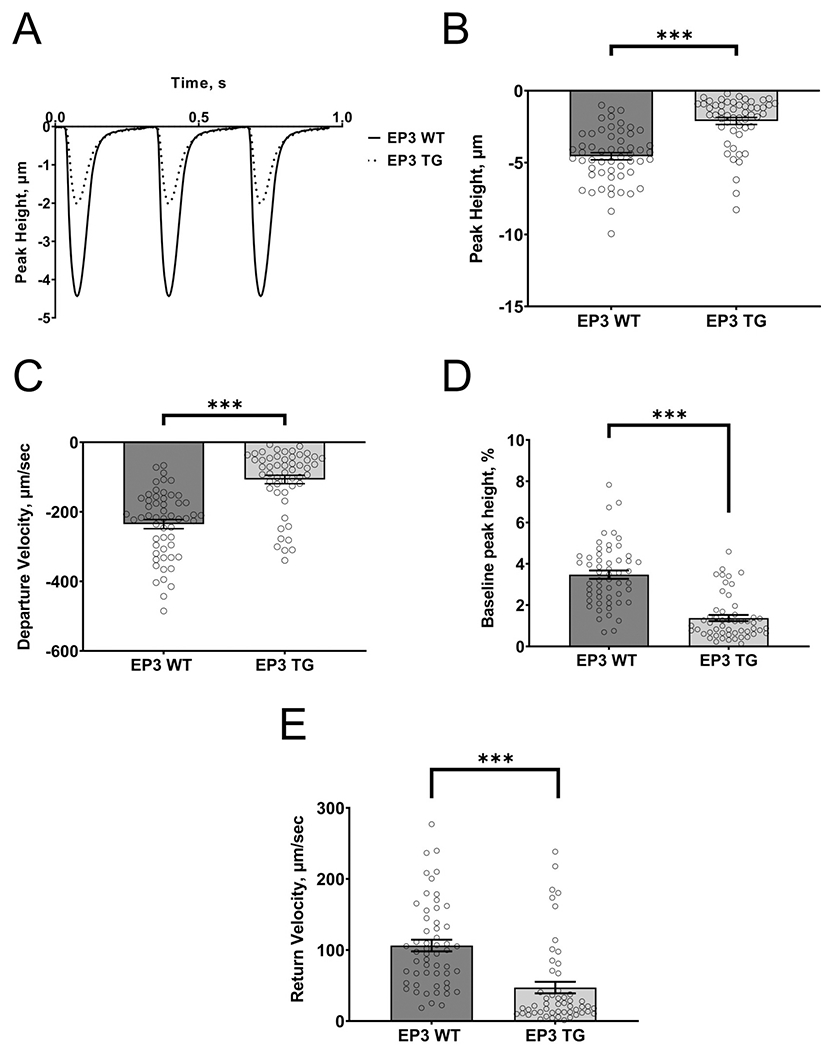
Figure 2.

Effect of EP3 overexpression in cardiac myocytes on cell shortening. (A) Representative tracings of transients from EP3 WT (dotted line) and EP3 TG (solid line) cells paced at 3 Hz. (B) Mean quantitative data of peak height. (C) Mean quantitative data of the speed of contraction (departure velocity). (D) The baseline as a percentage of peak height. (E) Mean quantitative data of the speed of relaxation (return velocity). ***p<0.001. N=56 cells from 7 mice for EP3 WT and N=53 cells from 5 mice for EP3 TG.
