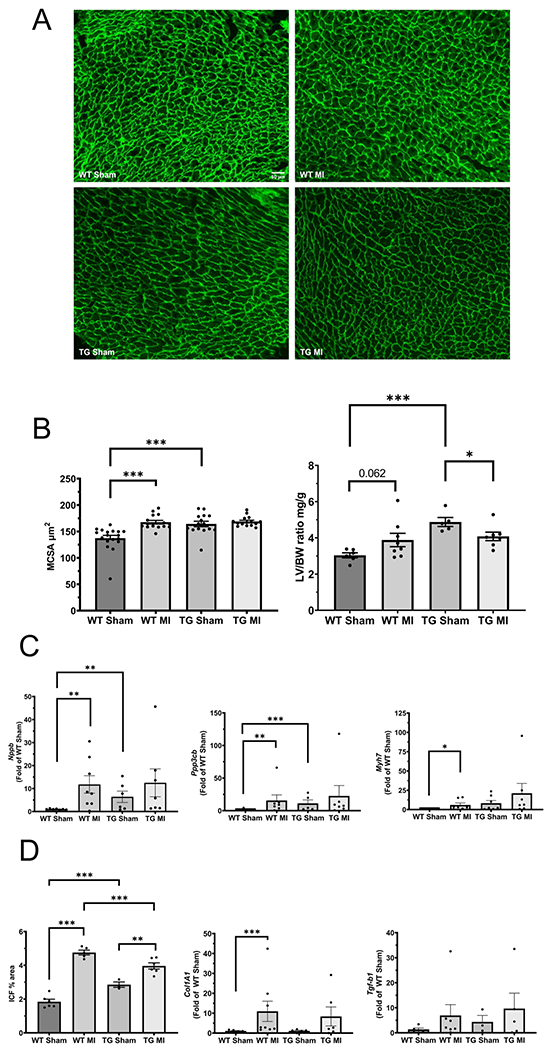
Figure 3.

Effect of EP3 overexpression on cardiac hypertrophy and fibrosis. (A) Representative images of peanut agglutinin staining for myocyte cross sectional area analysis taken under the 20x objective (scale bar indicates 50 μm). (B) Left panel-quantitative analysis of MCSA, and Right panel – an additional measure of hypertrophy, left ventricle to body weight ratio. (C) mRNA expression of hypertrophic gene markers; left panel –brain natriuretic peptide (Nppb), middle panel – calcineurin (Ppp3cb), and right panel – myosin heavy chain (Myh7). (D) Measurements of fibrosis; left panel – quantitative analysis of interstitial collagen fraction (ICF), middle panel – mRNA expression of collagen 1A (Col1A1), right panel – mRNA expression of transforming growth factor β (Tgf-b1). MCSA and ICF quantitative analysis was performed using NIH Image J software. * p<0.05, *** p<0.001 N=5-6/group. All mRNA expression data was corrected to GAPDH and presented as a fold of wildtype sham control group. *p<0.05, **p<0.01, ***p< 0.001. N = 5-7 for wildtype sham, N = 3-7 for transgenic sham, N = 5-8 for wildtype MI, N = 4-6 for transgenic MI.
