
Figure 3. Multivariable modeling shows elevated TF remains highly prognostic for worse overall survival across tumor types even after adjusting for established disease-specific prognostic markers.
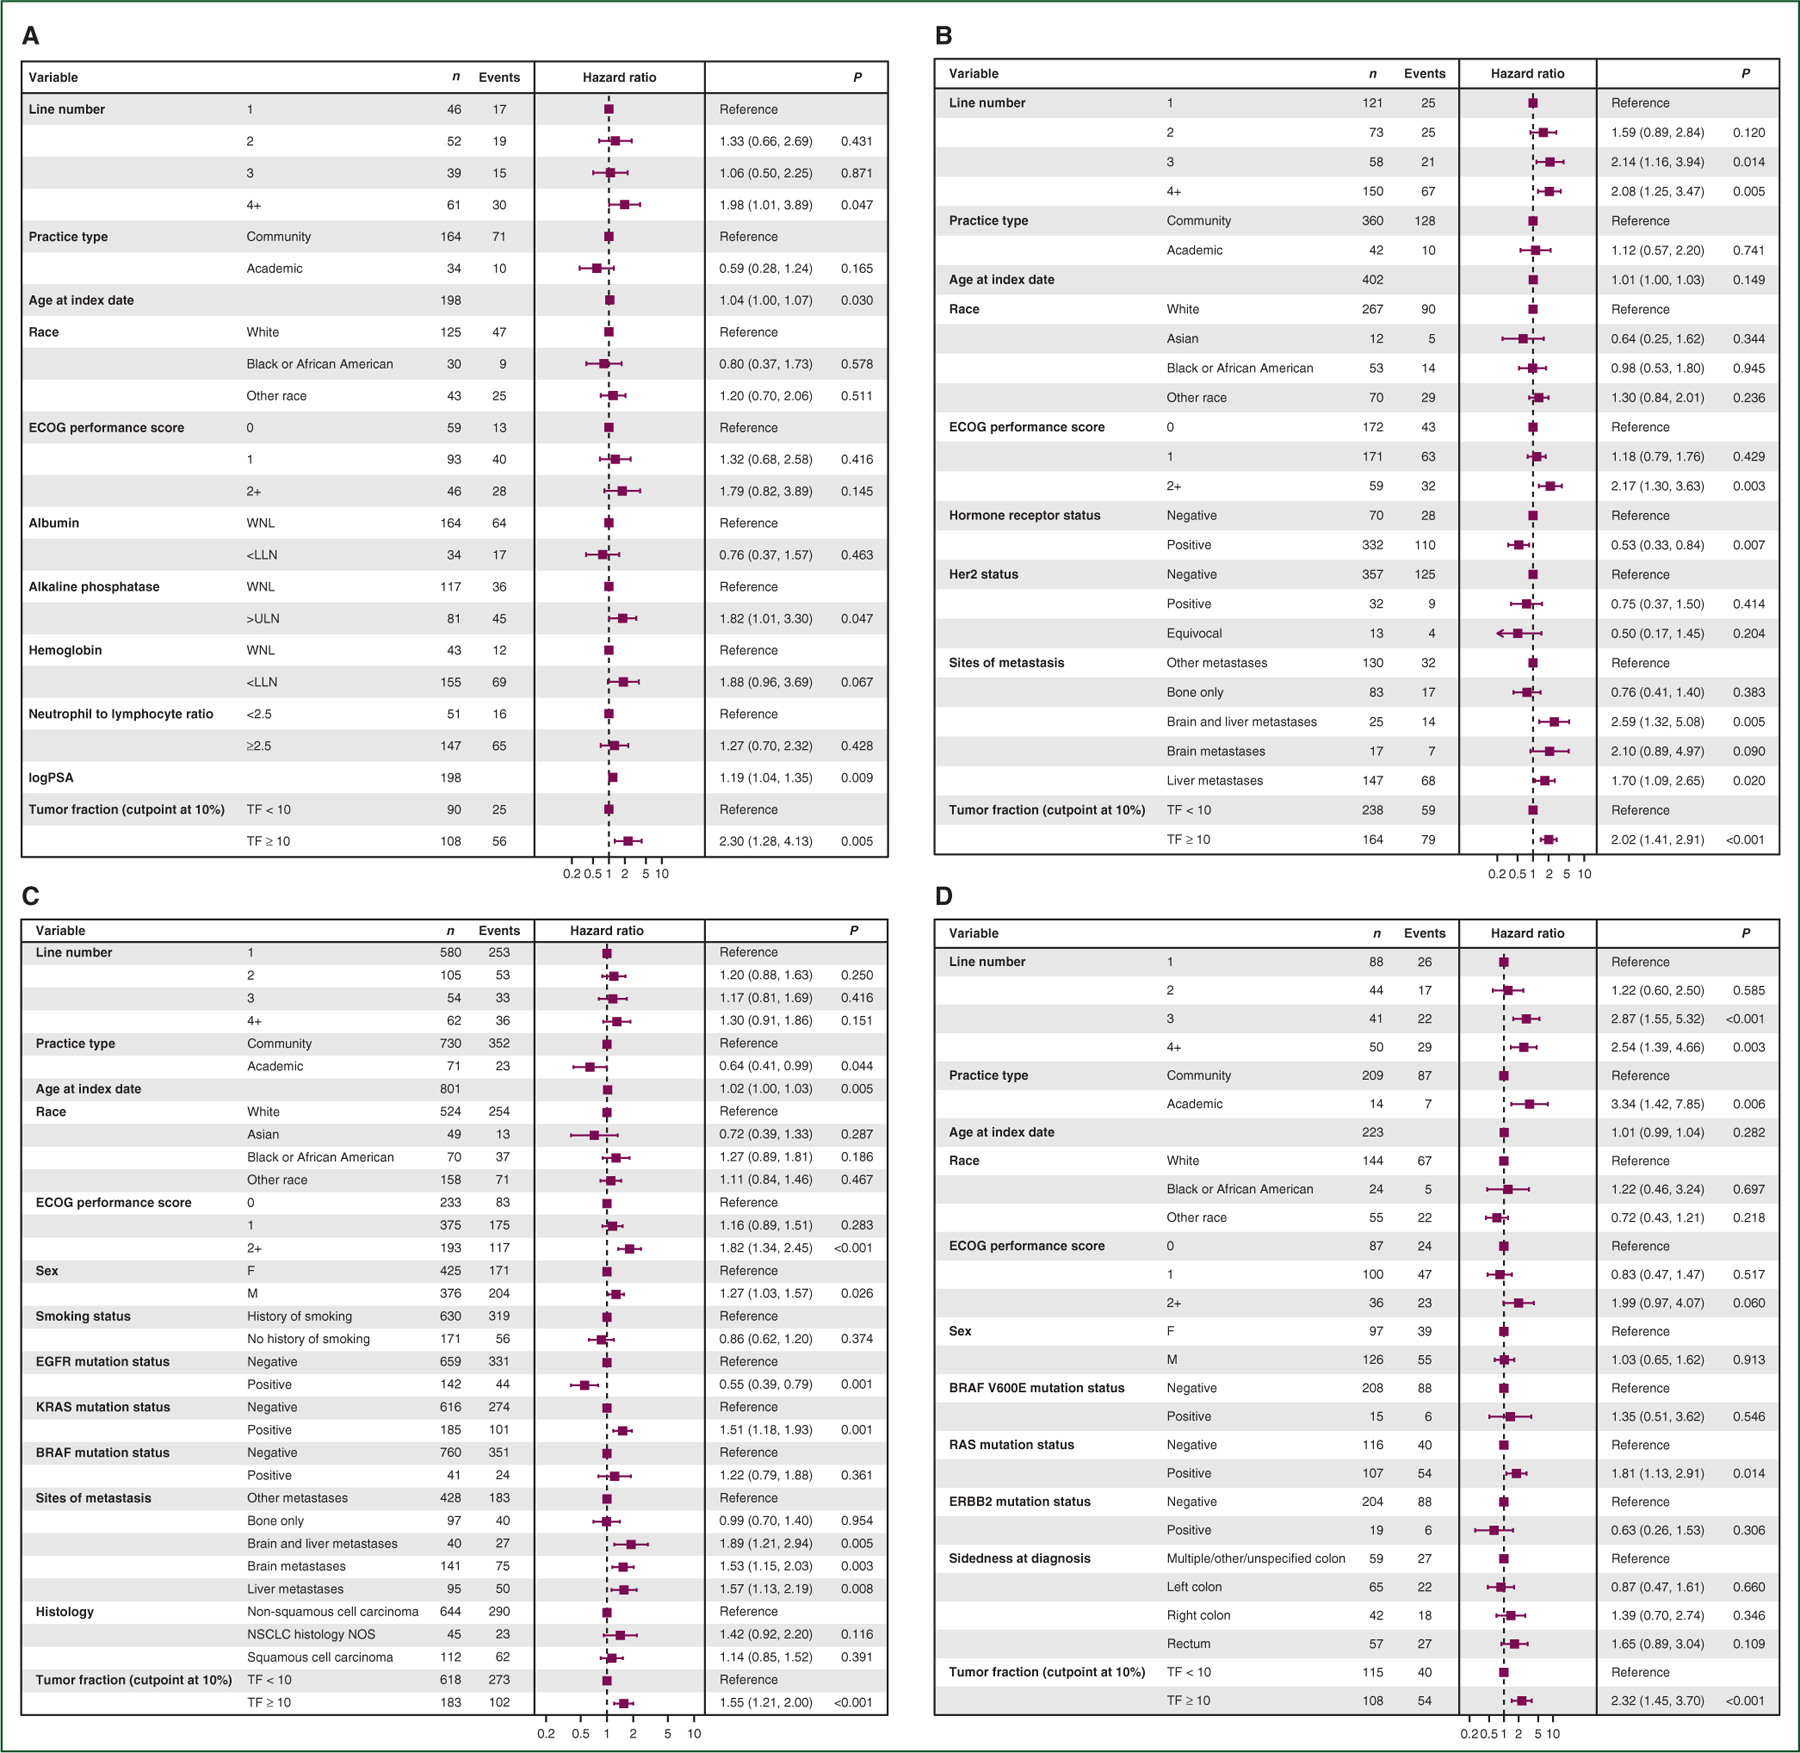
Forest plots showing hazard ratios for each variable used in multivariable Cox proportional hazards modeling for (a) mCRPC, (b) mBC, (c) aNSCLC, and (d) mCRC. aNSCLC, advanced non-small-cell lung cancer; ECOG, Eastern Cooperative Oncology Group; LLN, lower limit of normal; mBC, metastatic breast cancer; mCRC, metastatic colorectal cancer; mCRPC, metastatic castration-resistant prostate cancer; TF, tumor fraction; ULN, upper limit of normal; WNL, within normal limits.