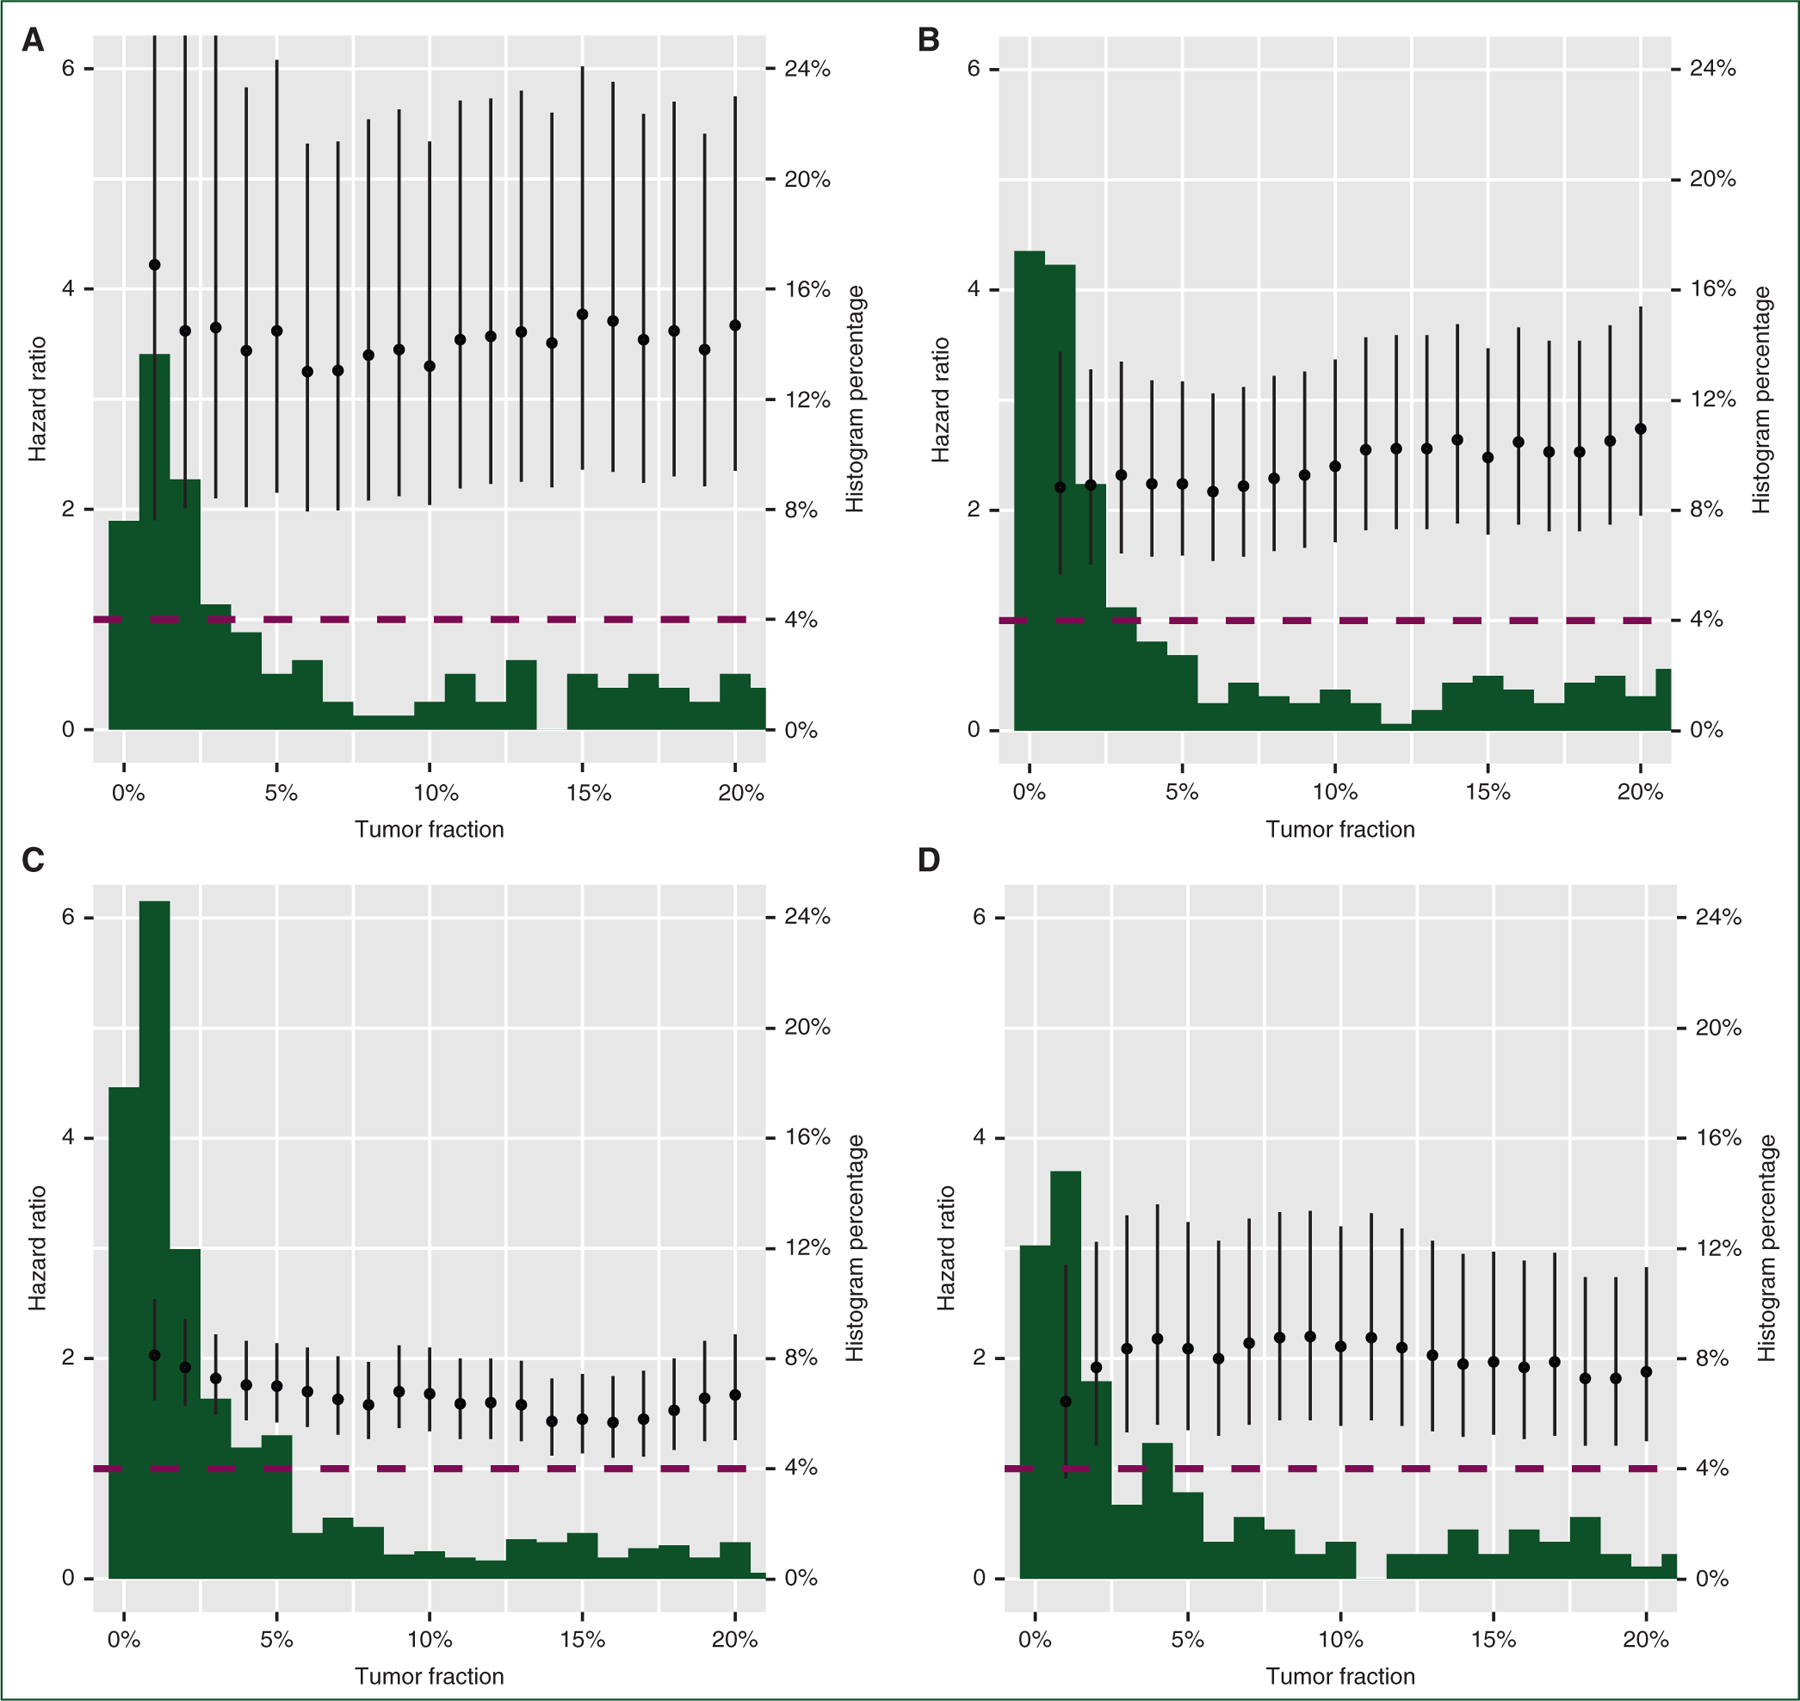
Figure 4. Exploratory analysis of varying the tumor fraction cutpoint shows tumor fraction remains prognostic for real-world overall survival across tumor types regardless of the cutpoint.

Exploratory analysis of the effect of varying the cTF cutpoint on the hazard ratio for the TF high versus TF low groups in univariable Cox proportional hazards models. Cutpoints between 1% and 20% are tested in increments of 1% in (a) mCRPC, (b) mBC, (c) aNSCLC, and (d) mCRC. The dotted line shows a hazard ratio of 1. Behind each plot of hazard ratios is a histogram of TF values between 1% and 20%, expressed as a percentage of all patients per disease. The full histogram is presented in Supplementary Figure S2, available at https://doi.org/10.1016/j.annonc.2022.09.163.
aNSCLC, advanced non-small-cell lung cancer; mBC, metastatic breast cancer; mCRC, metastatic colorectal cancer; mCRPC, metastatic castration-resistant prostate cancer.
