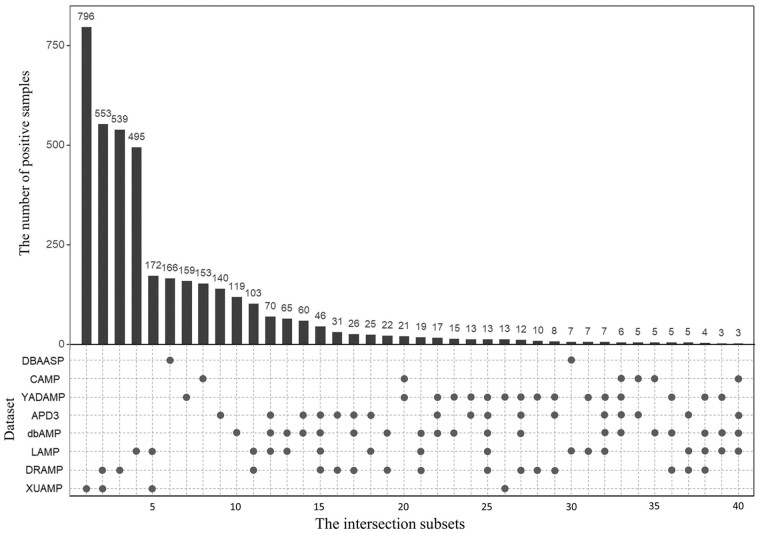
Fig. 1.
The number of overlapping positive samples among the eight independent test positive datasets. There are two parts in this figure. The upper part shows the number of positive samples in each intersection subset. Only the intersection subsets with more than two positive samples are shown. The bottom part shows the detailed information of the eight independent test positive datasets, where the black spots indicate that the corresponding independent test positive datasets listed in the y-axis share the intersection subset listed in the same column in the upper part. For examples, for column 11, there are 2 black spots in the bottom part, indicating that the independent test datasets LAMP and DRAMP share the intersection subset with 103 positive samples. In other words, LAMP and DRAMP share 103 common positive samples

