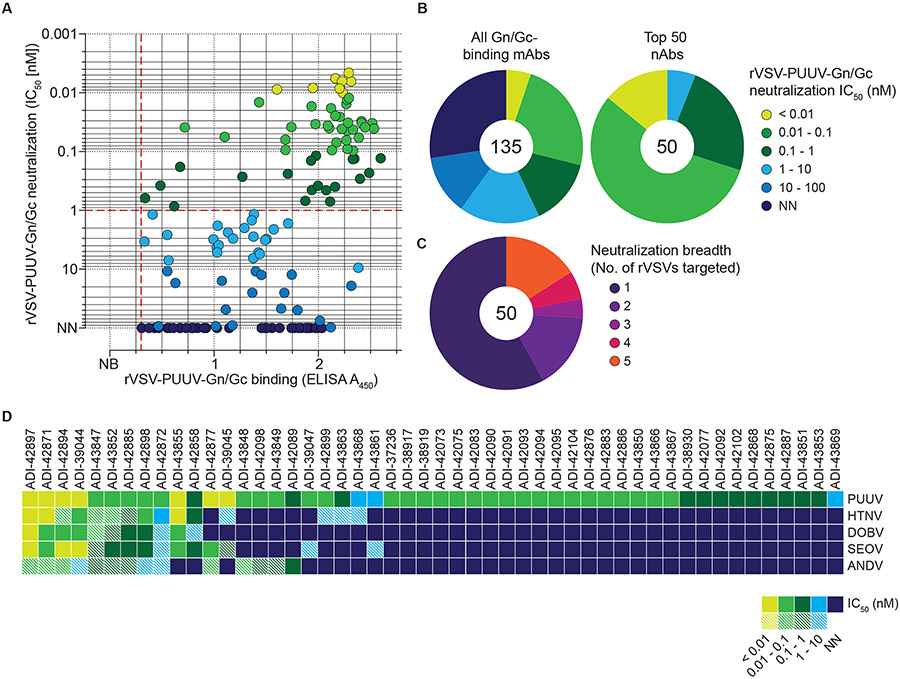
Fig. 2: Neutralization activity of PUUV Gn/Gc-reactive mAbs.
(A) Binding activity of mAbs (25 nM) to rVSV-PUUV-Gn/Gc, as determined by ELISA (see Fig. 1D), plotted against IC50 values calculated from rVSV-PUUV-Gn/Gc neutralization curves displayed as averages (n≥4) from at least two experiments (also see Fig. S3). Data points are colored according to neutralization activity with data points in shades of blue indicating IC50 > 1 nM and points in shade of green indicating IC50 < 1 nM. Antibodies with IC50 values >100 nM are designated as non-neutralizers (N.N.). Dashed red lines indicate the threshold for PUUV Gn/Gc binders (A450=0.3; x-axis) and potent neutralizers (IC50=1 nM; y-axis). (B) Frequency of mAbs grouped according to their neutralization activity. Number in the center of the pie chart denotes the total number of mAbs analyzed. (C) Frequency of prioritized mAbs grouped according to their neutralization activity towards rVSVs bearing divergent OWH and NWH Gn/Gc. Number in the center of the pie chart indicates the total number of mAbs analyzed. Each group is represented as a segment proportional to the group size. (D) Neutralizing activity of 50 prioritized mAbs (IC50 values) against the indicated rVSVs. mAbs with IC50>10 nM are designated non-neutralizers (N.N.), and mAbs leaving an un-neutralized virus fraction are depicted as striped squares. An un-neutralized virus fraction is defined as a residual normalized virus infection of >5% at the highest mAb concentration tested. Averages of IC50 values (n≥6) from at least two experiments.

