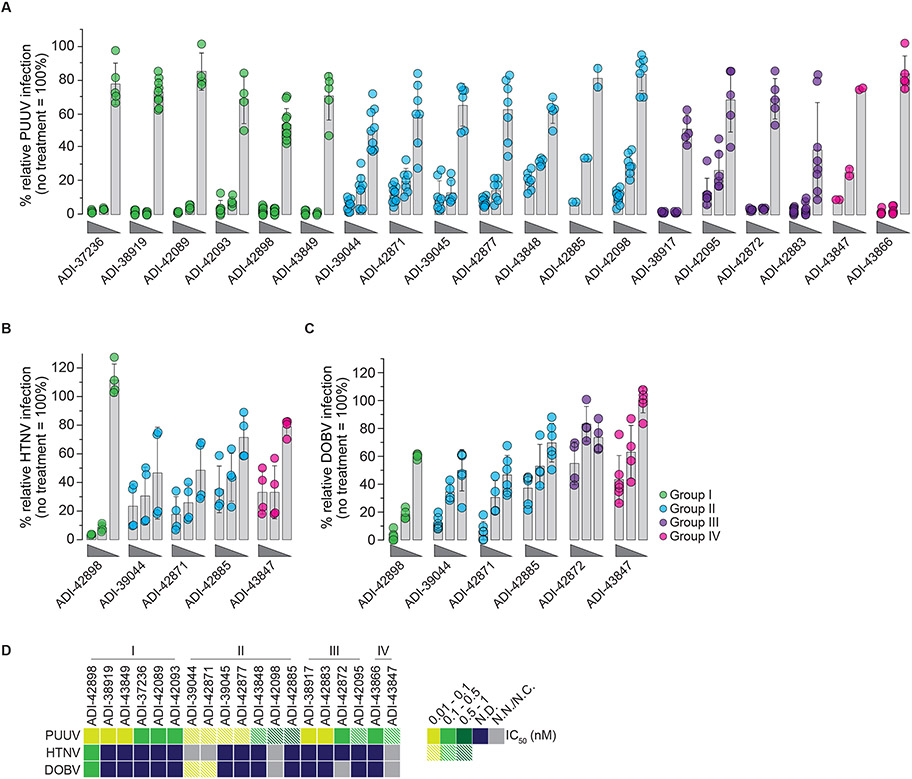
Fig. 6: Neutralization potency of mAbs against authentic Old World hantaviruses (OWH).
Potency of mAbs to block OWH PUUV (A), HTNV (B), and DOBV (C) infection of VeroE6 cells (mAb concentrations of 100, 4, and 0.04 nM). Data points are colored according to the mAb’s competition group assignments defined in Fig. 3: Group I, green; Group II, blue; Group III, purple; Group IV, pink. Averages ± standard deviation (s.d.), n=2-10 from one to five experiments (PUUV); n=4 from two experiments (HTNV); n=4-6 from two to three experiments (DOBV). (D) Heatmap of IC50 values isolated from PUUV, HTNV, and DOBV dose-response neutralization curves (A-C) derived by non-linear regression analysis. Data points are colored according to the mAb’s neutralization potency. mAbs with IC50 values >5 nM are designated non-neutralizing mAbs (N.N.); mAbs whose neutralization curves did not adhere to a sigmoidal dose-response fit and for which an IC50 could not be computed are designated as N.C. mAbs leaving an un-neutralized virus fraction are shown as striped data points on the map. An un-neutralized virus fraction is defined as a residual normalized virus infection at the highest mAb concentration tested of >5%. N.D., not determined.

