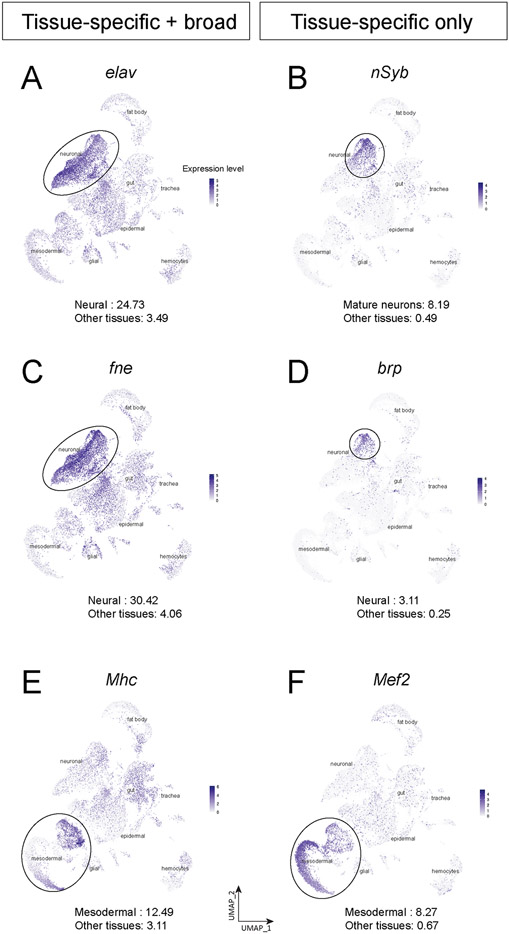
Figure 2. Tissue-specific proteins can be widely transcribed.
(A-F) Plots of elav (A), nSyb (B), fne (C), brp (D), Mhc (E), and Mef2 (F) expression level in whole embryo single-cell atlas. The number at the bottom of each panel is the average expression level of the gene in the specific tissue (top) or other tissues (bottom) computed by the AverageExpression function in Seurat.

