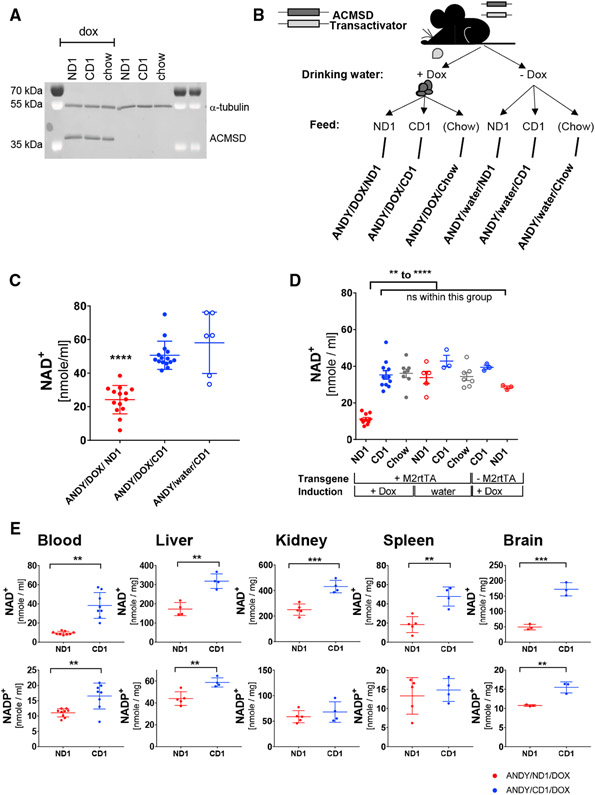
Figure 2. Doxycycline-Inducible Expression of hACMSD Results in Dietary Niacin-Dependent Decrease in NAD+ and NADP+ Levels.
(A) ACMSD overexpression remained stable for at least 4 months. Immunoblot analysis of hACMSD expression in liver from male transgenic ANDY littermates after 4 months on defined diets and continuous DOX administration. Different niacin content in feed did not affect transgene expression. Alpha-tubulin served as loading control.
(B) Design of feeding trials. DOX administration induced hACMSD transgene expression (Dox); animals without ACMSD expression were controls (water). Within each group, equal numbers of mice were assigned to a niacin-depleted diet (ND1), a niacin-replete but otherwise identical diet (CD1), or chow feed (chow; diet compositions in Tables S1 and S2).
(C and D) Reduced blood NAD+ in male ANDY mice after 3 weeks (C) and 12 weeks (D) on niacin-free diet (ND1) compared to controls without hACMSD overexpression or on niacin-replete feed (CD1, chow). Data on ANDY/DOX/ND1 and ANDY/DOX/CD1 mice are from 4 and 3 independent experiments in (C) and (D), respectively. All dataata represent mean ± SEM.
(E) Lower NAD+ levels in ANDY mice after 10 weeks on ND1 in all tissues tested. NADP+ levels were also lower, with significant differences only seen in blood, liver, and brain. Dots represent individual mice in (C)–(E): red dots are ANDY/Dox/ND1, blue dots are ANDY/DOX/CD1. One-way ANOVA, Tukey’s multiple comparison test. All data represent mean ± SD.
**p < 0.01, ***p < 0.001.
See also Figures S1, S2, and S3.

