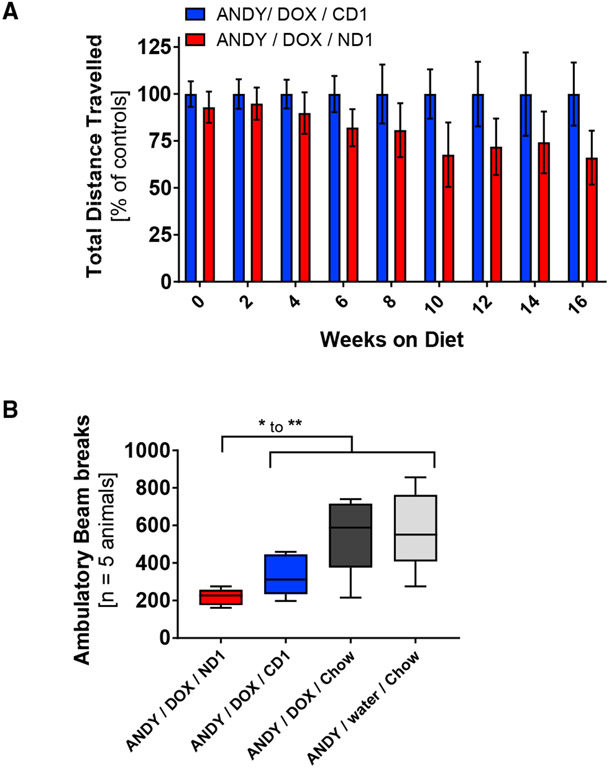
Figure 7. Activity Levels Drop over Time with Progressing Niacin Deficiency.
The physical activity of animals was measured as distance traveled in an open field test (m/5 min) and as number of ambulatory beam breaks.
(A) ANDY/DOX/ND1 distance traveled dropped significantly over time on diet compared to ANDY/DOX/CD1. One-way ANOVA with post-test for linear trend indicated a significant linear decline of activity (slope of −3.658, p = 0.034) in NAD+-deficient males compared to controls. Data represent mean ± SEM.
(B) Less locomotion indicated by fewer ambulatory beam breaks in NAD+-deficient males compared to controls; n = 5 per group; Student’s t test and 1-way ANOVA. Data represent box and whisker blots with Tukey’s whiskers.
*p < 0.05, **p < 0.01.

