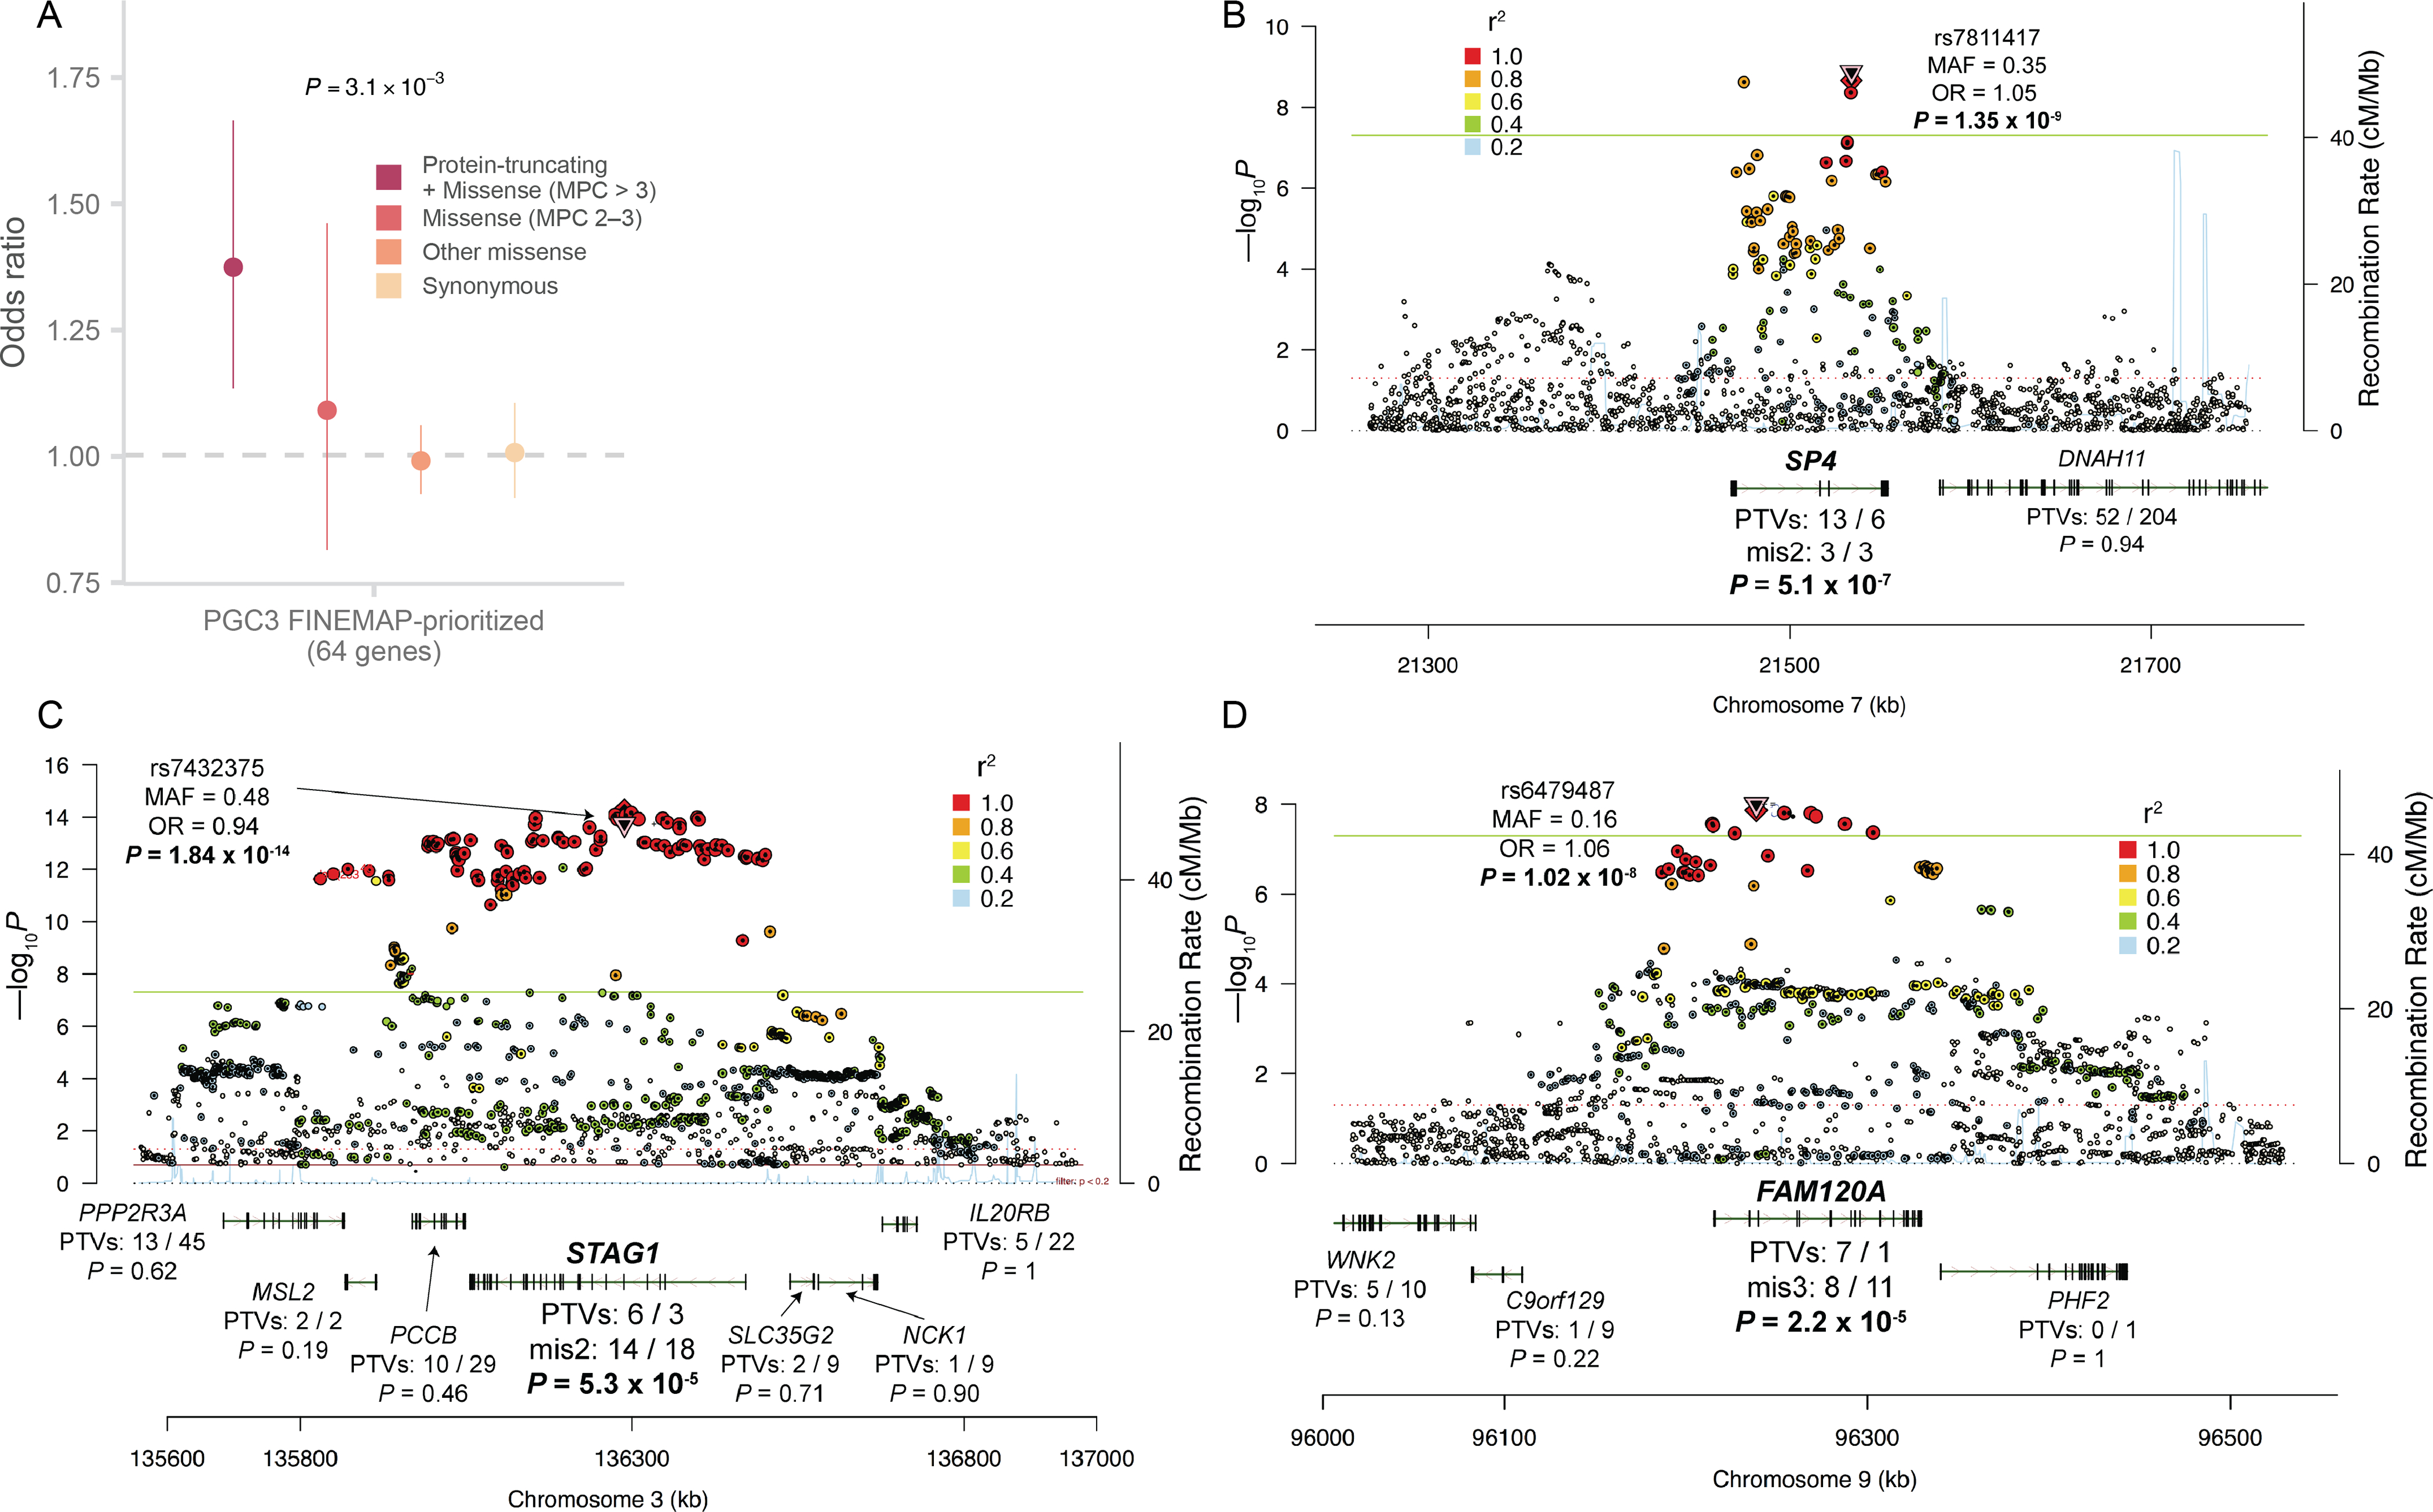
Figure 4. Shared genetic signal with schizophrenia GWAS.

A: Case-control enrichment of ultra-rare protein-coding variants in genes prioritized from fine-mapping of the PGC schizophrenia GWAS (n = 22,444 cases and n = 39,837 controls)13. The reported P value is from applying the Fisher’s combined probability method on the two-sided P values of Class I and Class II variants. The dot represents the odds ratio, and the bars represent the 95% CIs of the point estimates.
B, C, D: Prioritization of GWAS loci using exome data. The Locus Zoom plot of three GWAS loci is displayed. The two-sided P values of each SNP from the GWAS meta-analysis are shown along the y-axis. Below, for each gene in or adjacent to the region, we show the case-control counts of PTVs in the exome data, along with the two-sided burden test meta-analysis P values. SP4, STAG1 and FAM120A are highlighted as the only genes with notable signals in the exome data within each locus.
