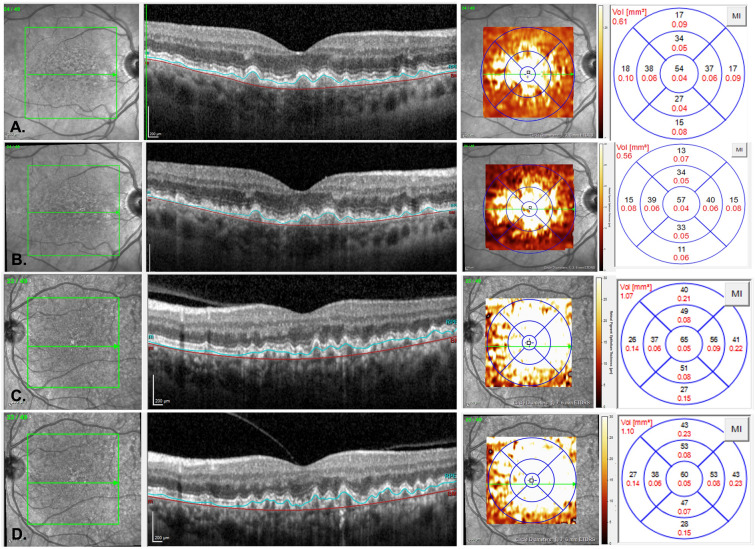
Fig. 4.
Representative OCT B-scans of macular drusen volume changes in PBM (A,B) and sham (C,D) subjects that completed all study treatments. A PBM subject with overall ETDRS drusen volume of 0.61 mm3 at baseline. B At end of study (month 10), the PBM subject showed a reduction in macular drusen volume to 0.56 mm3. C Sham subject with overall ETDRS drusen volume of 1.07 mm3 at baseline. D At end of study (month 10), the sham subject showed an increase in macular drusen volume to 1.10 mm3. Segmentation of Bruch’s membrane (red line) and the RPE (blue line). ETDRS early treatment diabetic retinopathy study, PBM photobiomodulation

