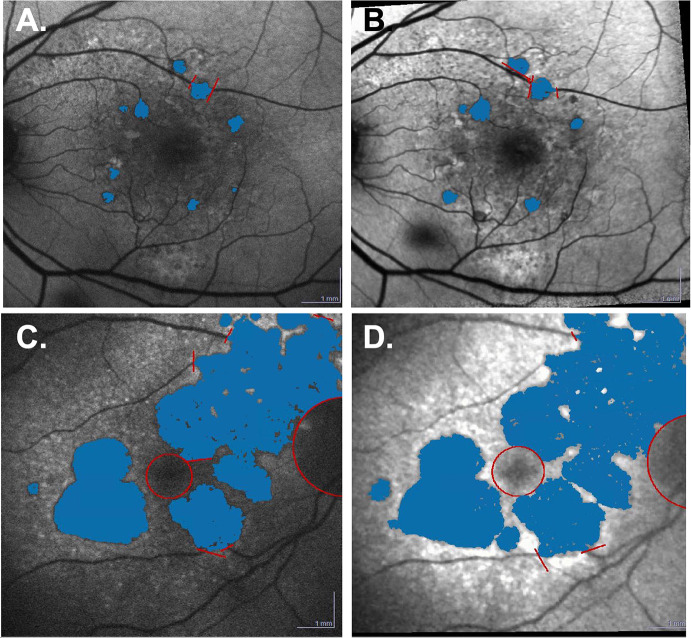
Fig. 5.
Representative FAF scans of geographic lesion growth in PBM and sham subjects that completed all study treatments. The hypoFAF lesions, corresponding to the GA lesions, were semiautomatically assessed using the Heidelberg region finder and marked in blue. A PBM subject showing overall lesions of 0.58 mm2 at baseline. B At end of study (month 10), the lesions had grown to 0.78 mm2. Following PBM treatment, the difference in lesion area was 0.16 mm2. C Sham subject showing overall lesions of 20.53 mm2 at baseline. D At the end of study (month 10), the lesion exceeded the image. The measured area was 25.6 mm2. Following sham treatment, the difference in lesion area was 5.07 mm2. FAF fundus autofluorescence

