Fig. 6.
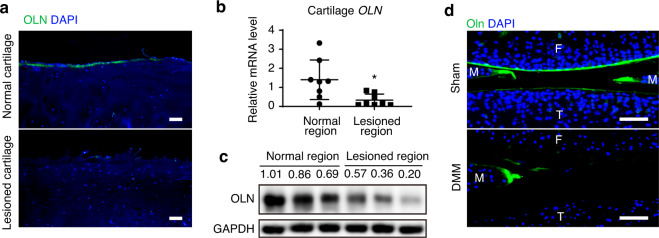
Expression analysis of Oln in OA cartilage. a Immunostaining of human OLN in the articular cartilage of control and OA patients. DAPI staining indicates the nucleus. Scale bars: 100 μm. b qPCR analysis of OLN mRNA levels in the articular cartilage of OA patients. Cartilage samples were separated into normal and lesioned regions based on their morphology (n = 8 samples per group). c Western blot analysis of OLN protein levels in the articular cartilage from OA patients (n = 3 samples per group). d Immunostaining of mouse Oln in the knee joints of sham and DMM-treated mice. Sham or DMM surgery was performed in 8-week-old wild-type mice, which were analyzed 8 weeks later (F: Femur; T: Tibia). DAPI staining indicates the nucleus. Scale bars: 100 μm. The statistical significance was assessed using two-tailed Student’s unpaired t tests. Data are presented as the mean ± SD (*P < 0.05)

