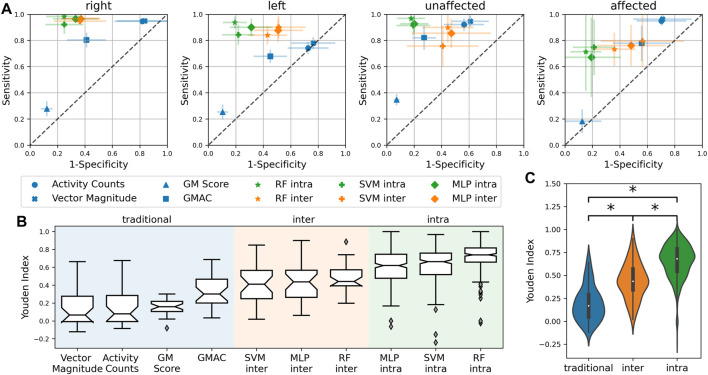
FIGURE 4.
(A) Sensitivity vs. ‘1-Specificity’ plots depicting the performance of the different measures. The closer a measure is to the top-left corner, the better its performance. The diagonal dashed gray line depicts the performance of a random classifier. (B) Boxplot showing the Youden indices for the measures. (C) Statistically significant difference between traditional, inter-subject machine learning and intra-subject machine learning measures. *Significant difference (p < 0.05).

