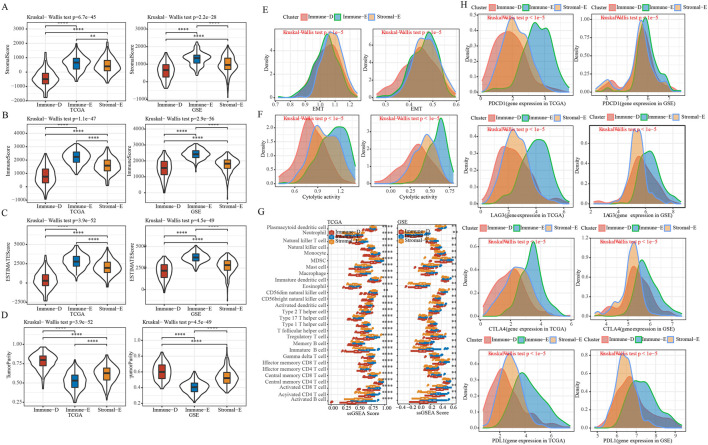
FIGURE 2.
Immune features of different subtypes. (A), Comparison of distribution of StromalScore in subtypes. (B), Comparison of distribution of ImmuneScore in subtypes. (C), Comparison of distribution of ESTIMATEScore in subtypes. (D), Comparison of distribution of TumorPurity in subtypes. (E), EMT score Comparison of distribution among subtypes. (F), Comparison of distribution of Cytolytic activity scores among subtypes. (G), Comparison of distribution of immune cell scores among subtypes. (H), Density distribution map of gene PD1, CTLA4, LAG3 and PD-L1 in different subtypes. * means p-value < 0.05, ** means p-value < 0.01, *** means p-value < 0.001, **** means p-value < 0.0001.

