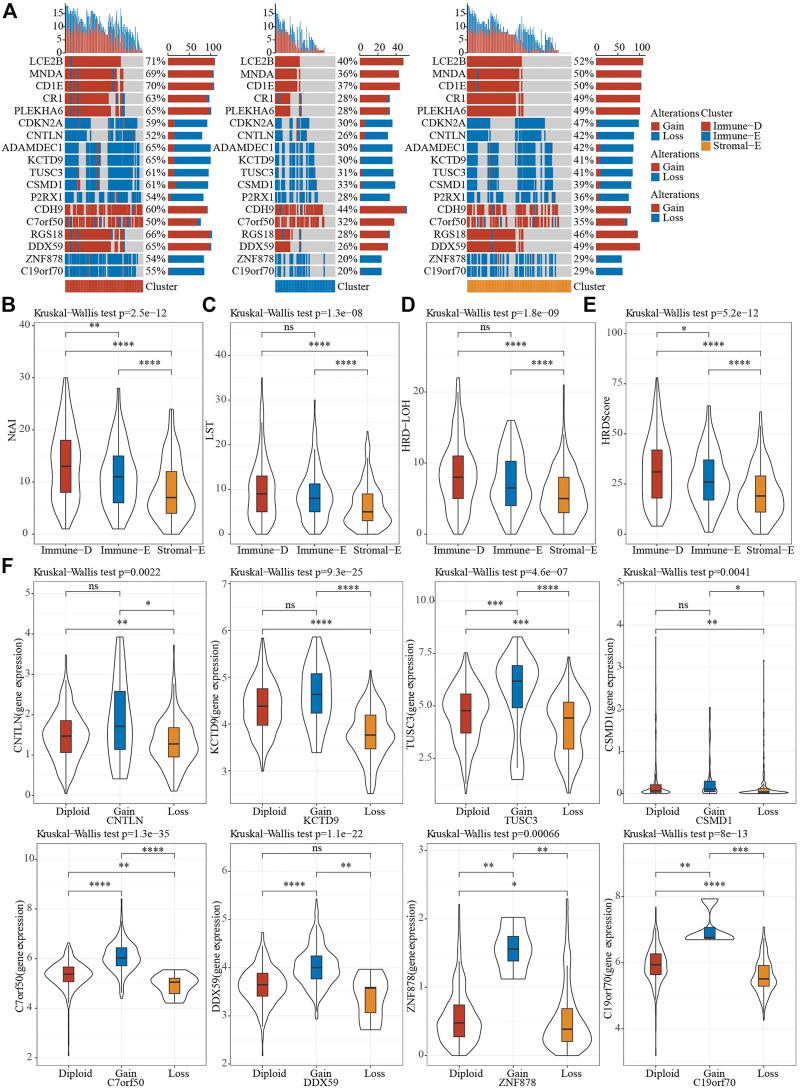
FIGURE 4.
CNV features of different subtypes. (A), CNV distribution of tumor driver genes. (B–E), Differences in NtAI, LST, LOH and HRD score of different subtypes, respectively. (F), Differences in gene expression by tumor driver gene CNV groupings. Ns means no significance, * means p-value < 0.05, ** means p-value < 0.01, *** means p-value < 0.001, **** means p-value < 0.0001.

