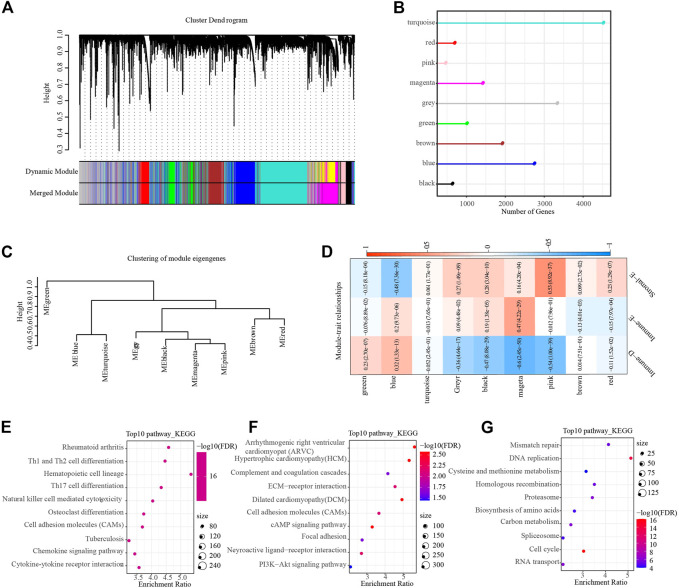
FIGURE 7.
WGCNA identifies functional modules associated with different subtypes. (A), Dendrogram of all genes clustered based on a dissimilarity measure. Different colors on the bottom panel represent different modules. (B), Lollipop plot showing the number of genes in different modules. (C), Clustering tree showing correlation between different modules. (D), Heat map showing module correlation with different subtypes. (E–G), The top 10 KEGG pathway in magenta (Immune-E), pink (Stromal-E) and blue (Immune-D) module, respectively.

