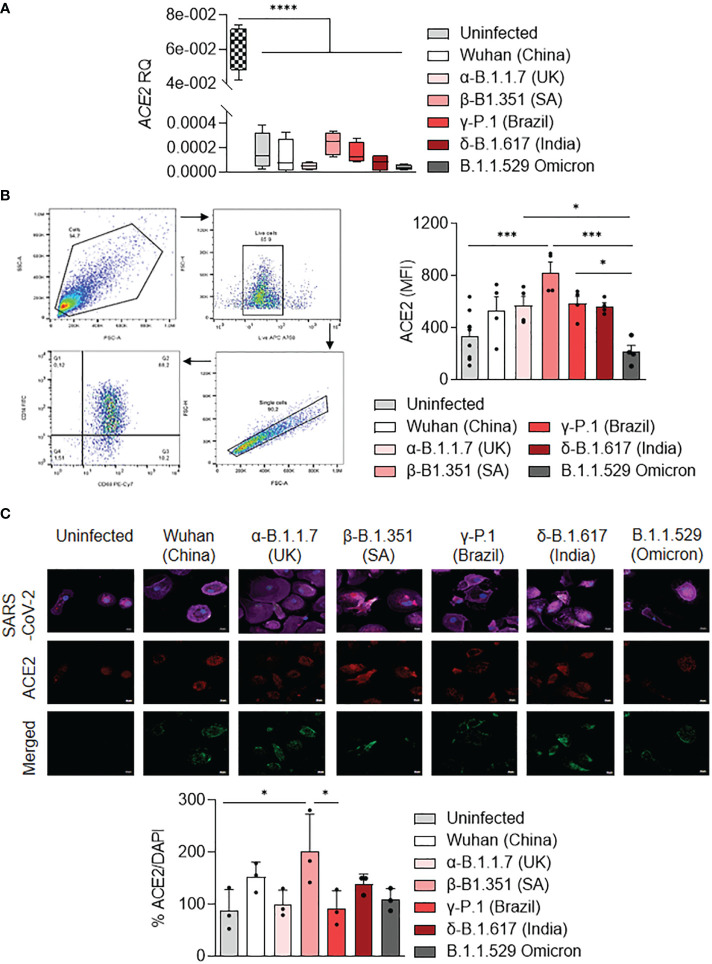
Figure 4.
ACE2 expression by MDM infected with SARS-CoV-2 variants. MDMs were infected with SARS-CoV-2 variants including Wuhan (China), α-B.1.1.7 (United Kingdom, UK), β-B.1.351 (South Africa, SA), γ-P.1 (Brazil), δ-B.1.617 (India) and B.1.1.529 (Omicron) (0.1 MOI). (A) Relative quantity of ACE2 gene was evaluated by q-RTPCR at 6 hours post-infection after normalization with housekeeping ACTB gene as endogenous control. Data values represent the mean ± SD from 4 healthy donors, and the experiments on unstimulated Vero E6 cells were performed in triplicate. (B) ACE2 protein expression was quantified by flow cytometry in MDMs at 24 hours post-infection and expressed as mean fluorescence intensity (MFI) values. (C) ACE2 was evaluated by immunofluorescence in MDMs at 24 hours post-infection. ACE2 was identified in red, SARS-CoV-2 in green, F-actin in purple and DAPI. Relative ACE2 expression was quantified by fluorescence with ImageJ software. Statistical analysis was performed with two-way ANOVA and Tukey’s multiple comparison test. *p ≤ 0.05, ***p ≤ 0.001 and ****p ≤ 0.0001.

