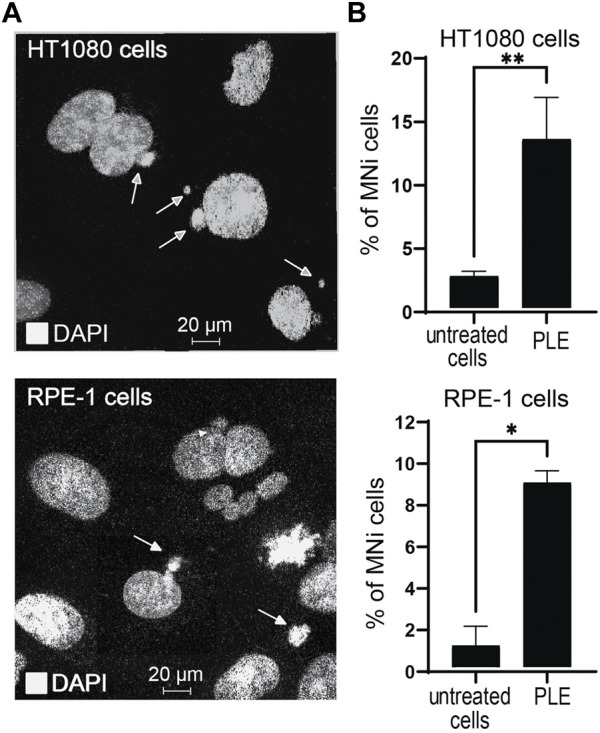
FIGURE 6.

Micronuclei (MNi) formation 24 h after PLE treatment of HT1080 and RPE-1cells. (A) Examples of (MNi) formation in HT1080 and RPE-1 cells. White arrows point to the MNi. (B) The percentage of MNi after PLE treatment compared to untreated cells. Error bars correspond to a standard deviation (SD) of four replicates. Statistical analysis was performed using one-way ANNOVA, asterisks indicate statistical significance (*p < 0.05, **p < 0.01, relative to the negative control—untreated cells).
