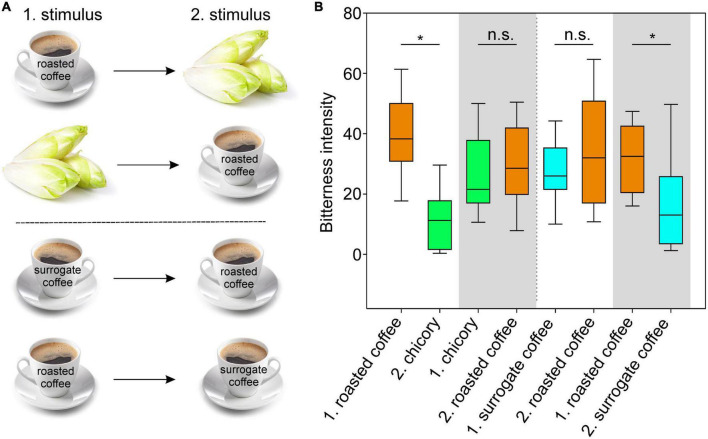
FIGURE 5.
Sequential testing of roasted coffee, surrogate coffee and chicory. (A) Schematic outline of the sensory experiment. (B) Graph of the experimental results of sensory tests. Volunteers rated the bitterness of roasted coffee (brown boxes), fresh chicory leaves (green boxes), and surrogate coffee (blue boxes) in sequentially offered pairs. To allow for adaptation, the first stimulus (1) was kept 30 s in the mouth before expectorating. After a brief sip of bottled water, the second stimulus (2) was evaluated. Between the stimulus pairs (indicated at the x-axis, labeled by white/gray background colors), the experiment was interrupted for 30 min to allow recovery of bitter sensitivity. Y-axis, bitterness intensity. Statistically significant influences of the first stimuli on the second stimuli are indicated by asterisks p-values (*p < 0.02; n.s. = not significant). Statistics (One-way repeated measures ANOVA with Bonferroni’s t-test) were done using SigmaPlot (14.0).

