
FIGURE 3.
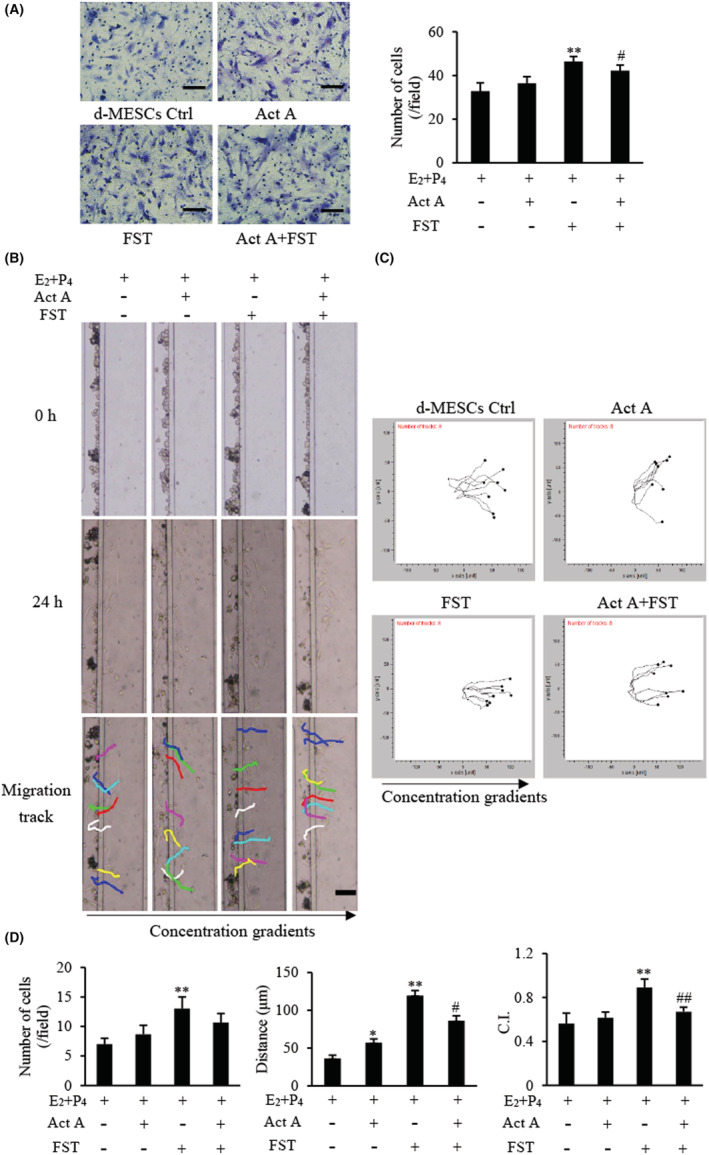
Effects of activin A and FST on migration of d‐MESCs. (A) The migration of d‐MESCs induced by activin A 5 ng/ml or/and FST 10 ng/mL was analysed by transwell migration assay. Cells that passed through porous membrane were stained with Giemsa. Scale bar = 100 μm. The graph showed the average number of migrated cells in three separate experiments. **p < 0.01, compared with d‐MESCs control group. #p < 0.05, compared with FST group. (B) Images of mouse d‐MESCs migration towards different concentrations activin A 5 ng/ml or/and FST 10 ng/ml were taken in the microfluidic device at 0 h and 24 h, respectively. Scale bar = 100 μm. (C) The tracked cell trajectories in activin A and/or FST gradient were analysed by Chemotaxis and Migration Tool software. Images represented the directions of migrated cell treated with activin A 5 ng/ml or/and FST 10 ng/ml. (D) The graph showed the average number, distance and chemotactic index (C.I.) of migrated cells in the same size fields of the microfluidic device in three separate experiments. *p < 0.05, **p < 0.01 compared with d‐MESCs control group. #p < 0.05, ##p < 0.01 compared with FST group.