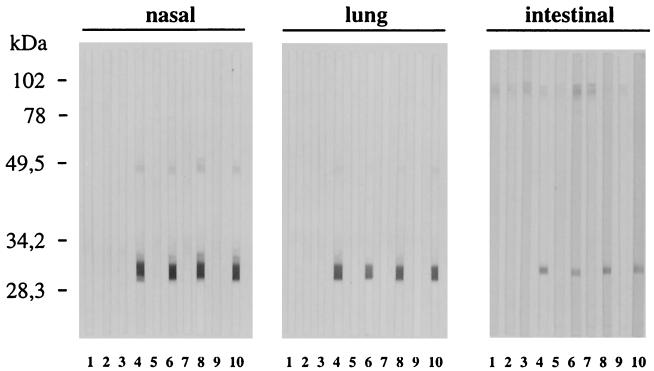
FIG. 3.
Western blot analysis of the local antibody response. Nasal, lung, and intestinal washes were analyzed for IgA specific for SAG1 protein. Washes for two or three mice of each group were done 15 days after the boost. Lanes: 1, untreated; 2, SAG1; 3, LTR72; 4, LTR72 plus SAG1; 5, LTK63; 6, LTK63 plus SAG1; 7, LT; 8, LT plus SAG1; 9, CT; 10, CT plus SAG1. Results from one of two similar experiments are shown.

