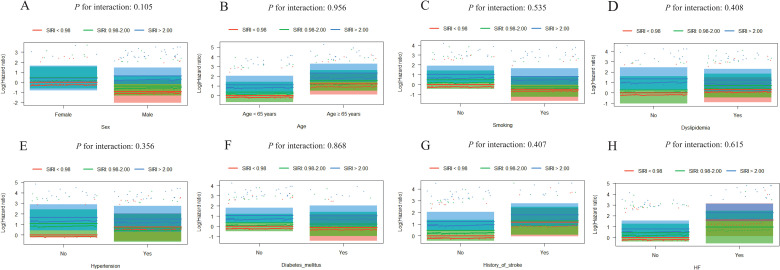
Figure 6.
Visualization of the possible interactions between SIRI and different subgroups. Subgroup analysis according to (A) sex, (B) age, (C) smoking, (D) dyslipidemia, (E) hypertension, (F) diabetes mellitus, (G) history of stroke, and (H) HF. Column charts in each subgroup do not cross, which demonstrates the independent association between SIRI and the prognosis of ACS patients undergoing PCI.

