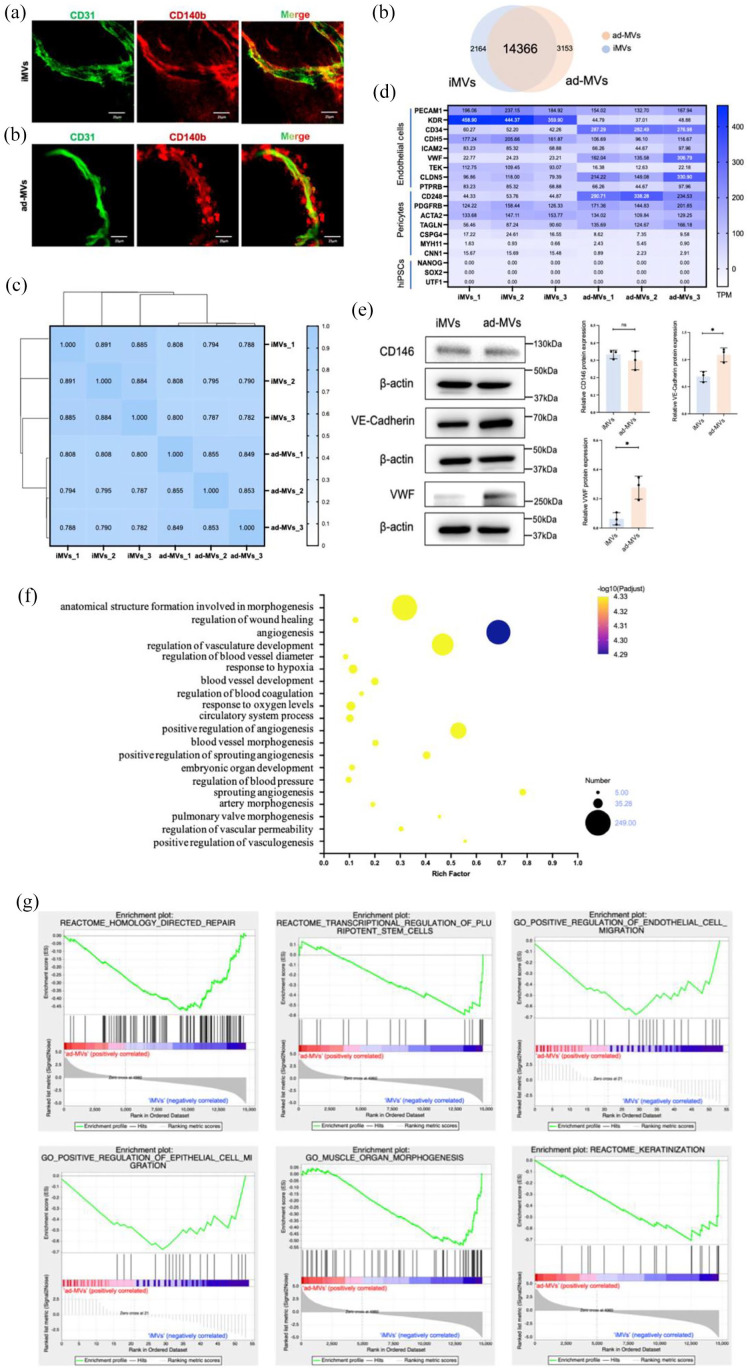
Figure 2.
Comparisons between iMVs and ad-MVs. (a) Immunofluorescence analysis of iMVs and ad-MVs showed similar luminal structures surrounded by ECs (CD31 in green) and pericytes (CD140b in red). Scale bar, 100 μm. (b) Venn diagram revealed the shared and differential genes between the iMVs and ad-MVs groups. (c) Correlation analysis between iMVs and ad-MVs groups by Spearman. 0.8 < ρ < 1.0 means significantly strong correlation; 0.6 < ρ < 0.8 means strong correlation. (d) The marker genes of ECs, pericytes, and hiPSCs in iMVs and ad-MVs groups. TPM values of the above genes were summarized from transcripts. (e) The expressions of CD146, VE-Cadherin, and VWF protein in iMVs and ad-MVs were detected by western blot analysis. Data were shown as mean ± SD of three independent experiments, ns indicates no significance, *p < 0.05, **p < 0.01. (f) Go enrichment analysis for angiogenic genes in iMVs groups. The horizontal axis represented the ratio of the rich factor. The size of the dot indicated the number of genes in the pathway, and the color of the dot corresponded to a different -log10 (Padjust value), p-value corrected by the False Discovery Rate (FDR) method. (g) GSEA analysis revealed that compared with ad-MVs, iMVs-VCs positively regulated migration of ECs and epithelial cells, involved in homology-directed repair, regulation of stem cells, muscle morphogenesis, and promoted keratinization. The upper curve of the graph represents the dynamic enrichment score (ES) value, and the highest point represents the ES value of this gene set. The middle part of the figure represents the sorted sequence of the hybridization data, and the vertical lines represent the genes in the chip dataset appearing in this gene set. The lower curve in the figure shows the sorted values. p < 0.01.

