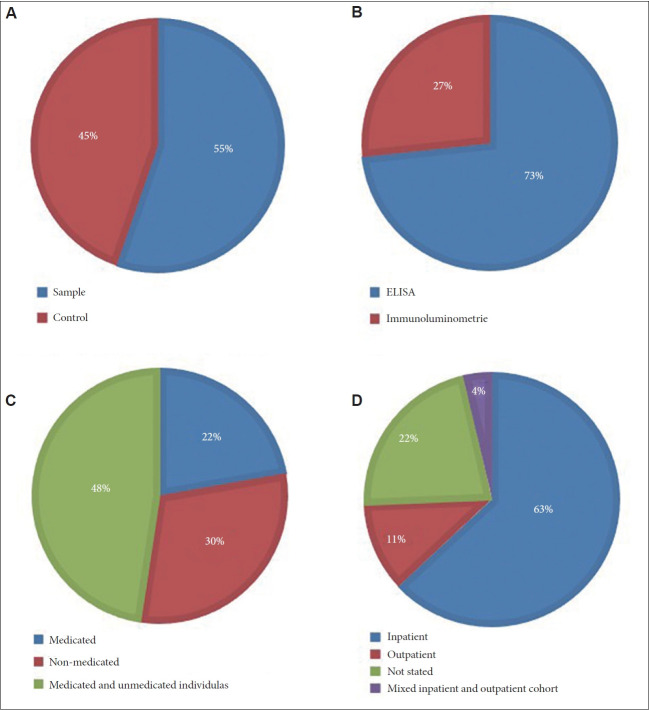
Figure 2.
Pie charts illustrating characteristics of individuals included in the S100B systematic review and meta-analysis. A: Case and control. B: Assay. Pie charts A and B are representative of the whole population of individuals. C: Medication status. D: Patient setting. Pie charts C and D are exclusively representative of individuals diagnosed with schizophrenia. Unmedicated individuals described in pie chart C represents individuals who were not taking antipsychotic medication for at least one week prior to study commencement. ELISA, enzyme linked immunosorbent assay.

