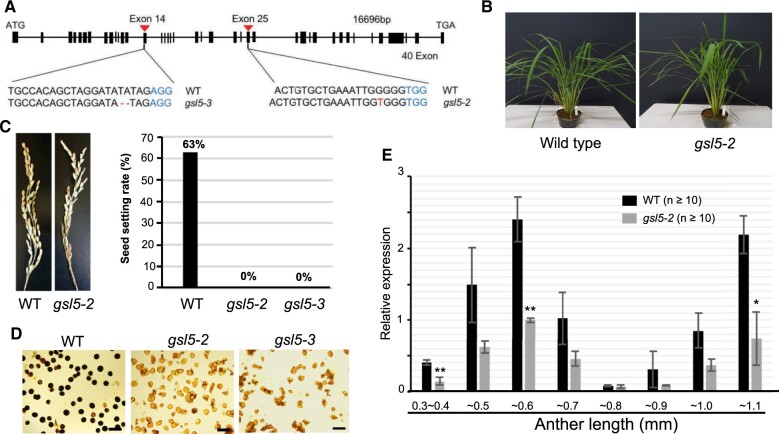
Figure 2.
The Osgsl5 mutant phenotype and OsGSL5 gene expression. A, Nucleotides deletion and insertion sites in Osgsl5-2 and Osgsl5-3 knock-out mutants. B, The vegetative plant growth was comparable between WT and Osgsl5-2. C, Images of panicles at seed filling stage of WT and Osgsl5-2 (left), and the graph showing seed setting rate of WT, Osgsl5-2, and Osgsl5-3 (right). D, Pollen viability test by iodine–potassium iodide staining of WT (left), Osgsl5-2 (middle), and Osgsl5-3 (right). Darkly and faintly stained grains were categorized as viable and nonviable pollen, respectively. Bar = 40 µm. E, The relative expression levels of OsGSL5 transcripts in WT and Osgsl5-2 anthers by RT-qPCR. Errors bars each indicate the standard deviation of the mean of three biological replicates. The n value in parentheses is the number of florets used in each replicate. Asterisks indicate significant differences (*P < 0.05, **P < 0.01 by Student’s t test) between WT and Osgsl5-2.

