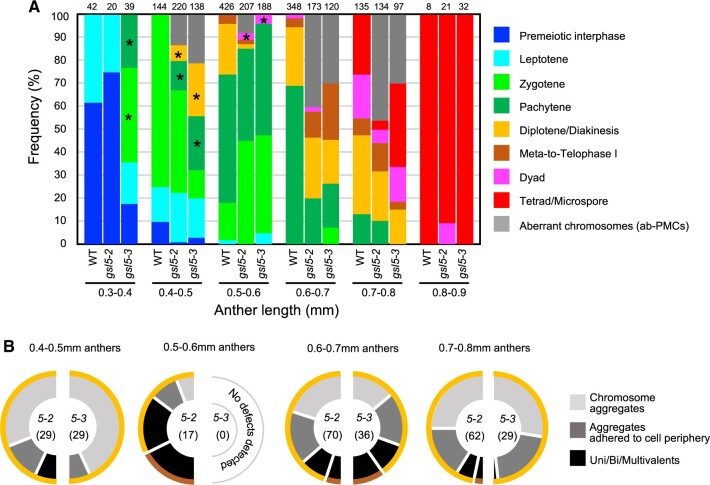
Figure 6.
Male meiosis progression and ab-PMC appearance in WT and Osgsl5 anthers. A, Frequency of PMC stage observed with respect to anther lengths in WT and Osgsl5 mutants, in which the frequency of ab-PMCs in Osgsl5 anthers was shown as gray bars. The number at the top of each bar indicates the absolute number of cells counted. The wl-PMC stages marked with asterisks indicate that those stages emerged much earlier than comparable stages observed in WT anthers. B, Each half-donut graph indicates frequency of three different classes for aberrant chromosomal morphologies and behaviors in Osgsl5-2 or Osgsl5-3 ab-PMCs observed along respective anther lengths. Colored outer rims on a half donut indicate meiotic stages of wl-PMCs that concomitantly emerge with respective classes of ab-PMCs. Definition of outer rim colors is consistent to that in (A). The number in parentheses represents the absolute number of cells counted.

