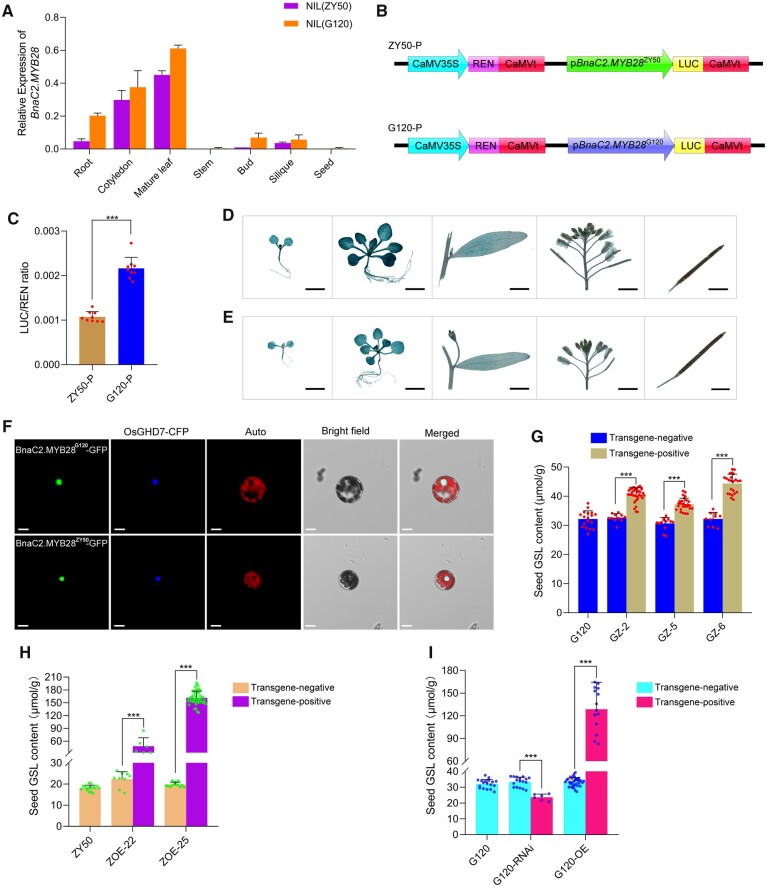
Figure 3.
Expression pattern, subcellular localization, and regulation analysis of SGC of BnaC2.MYB28. A, RT–qPCR analysis of BnaC2.MYB28 in NIL(ZY50) and NIL(G120). BnACTIN7 was used as a control. Error bars represent the sds from three independent RNA samples. B, Diagrams of the test constructs used in (C). C, Relative luciferase activity of promoters of BnaC2.MYB28G120 and BnaC2.MYB28ZY50 in Arabidopsis protoplasts. Each dot on the column represents an independent replicate. The activities of LUC were normalized as the ratio of LUC/REN activity. Data are shown as mean ± sd (n = 9). Error bars represent the sds. GUS analysis of BnaC2.MYB28G120 (D) and BnaC2.MYB28ZY50 (E) in transgenic wild-type Arabidopsis. Bars = 2 mm. F, Subcellular localization of BnaC2.MYB28 protein in Arabidopsis leaf protoplasts. The nuclear protein OsGHD7-fused CFP was used as a nuclear marker. Bars = 10 μm. G, SGC in G120, transgene-negative and transgene-positive T1 lines (GZ−2, GZ−5, and GZ−6). Each dot on the column represents an individual plant. H, SGC in ZY50 and BnaC2.MYB28ZY50 overexpression lines (ZOE−22 and ZOE−25) in the T1 generation. Each dot on the column represents an individual plant. (I) SGC of the WT, transgene-negative and transgene-positive T0 plants of the BnaC2.MYB28G120-RNAi and BnaC2.MYB28G120-OE transformants. Each dot on the column represents an individual plant. In (G), (H), and (I), data are shown as mean ± sd (n ≥ 6); error bars represent the sds; two-tailed Student’s t tests were used to generate the P-values. ***P < 0.001.

