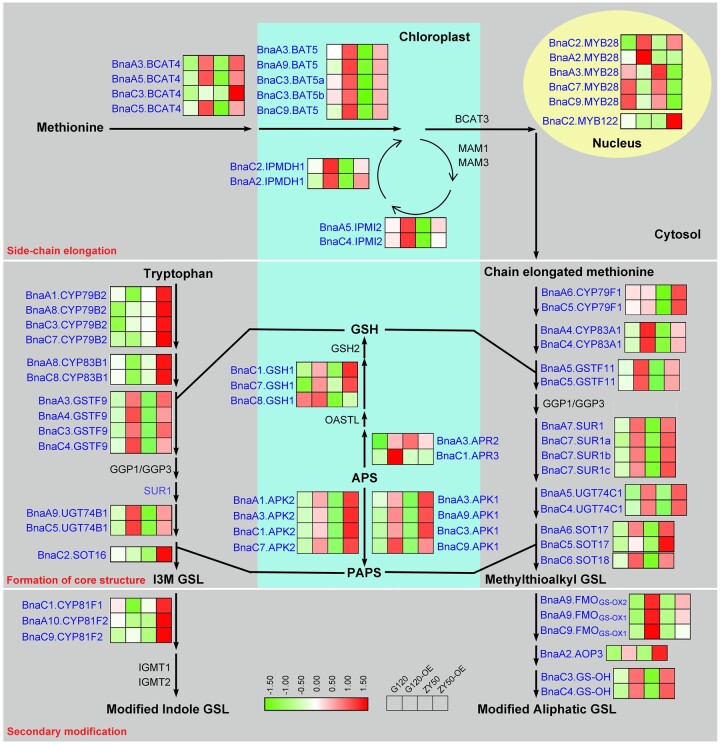
Figure 5.
Transcription levels of DEGs involved in GSL biosynthesis. The genes with black font showed no significant difference in expression level between parents and their overexpression lines (t test; significant, P < 0.05). Transcription levels are shown for two parental lines (G120 and ZY50) and corresponding overexpression lines of BnaC2.MYB28 (G120−OE and ZY50−OE). Red and green represent high and low gene expression, respectively. I3M, indolyl-3-methyl.

