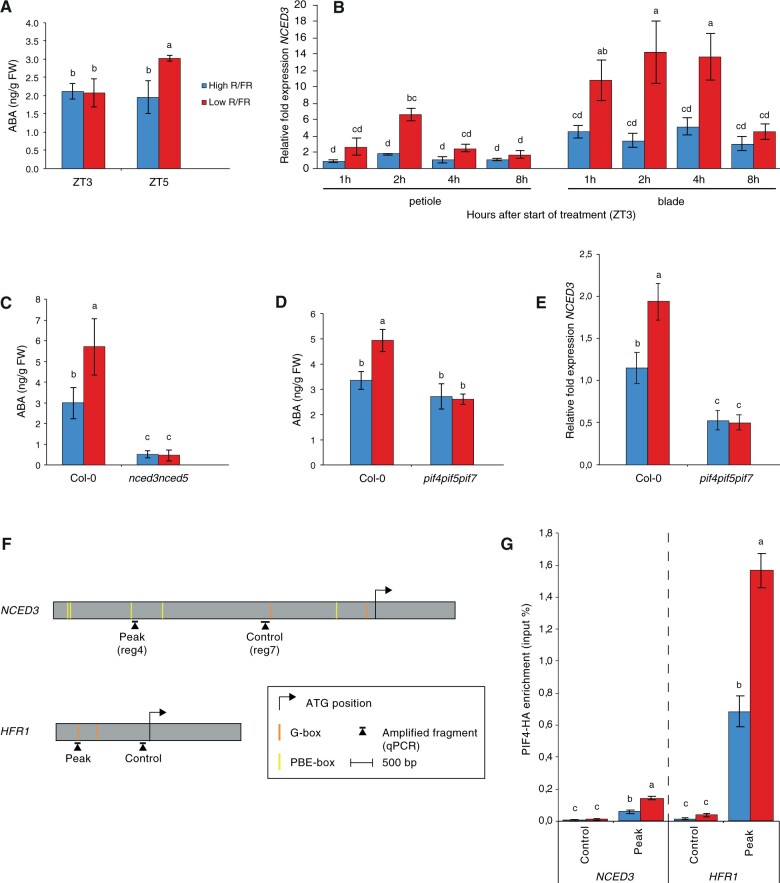
Figure 1.
LRFR induces PIF-mediated ABA biosynthesis in leaves. A, ABA concentration in entire Leaves 1 and 2 of wild-type (Col-0) in high R/FR (blue) versus low R/FR (red) conditions at 0 h (ZT3) and 2 h (ZT5) after start of treatment. Plants were grown for 14 d in standard LD (16-h light, 8-h dark [16/8]) conditions. ZT0 corresponds to the beginning of the light period on Day 15. Shade treatment started on Day 15 at ZT3 by adding FR light to decrease the R/FR ratio. Each bar plot represents data from four biological replicates. Per replicate, 40 leaves (Leaves 1 and 2) from 20 plant individuals were harvested and frozen in liquid nitrogen. B, Relative fold expression of NCED3 from leaf 3 of Col-0 plants in high R/FR (blue) versus low R/FR (red) conditions over time. Gene expression values were calculated as fold induction relative to a petiole sample at time=1 h (ZT4) in high R/FR conditions. Plants were grown for 15 d in standard LD (16-h light, 8-h dark [16/8]) conditions. ZT0 corresponds to the beginning of the light period on Day 16. Shade treatment started on Day 16 at ZT3 by adding FR light to decrease the R/FR ratio. Petioles and lamina of Leaf 3 were separately pooled into three biological replicates and frozen in liquid nitrogen. C, ABA concentration in rosettes of Col-0 versus nced3nced5 double mutant plants in high R/FR (blue) versus low R/FR (red) conditions at 2 h (ZT5) after start of treatment. Plants were grown for 14 d in standard LD (16-h light, 8-h dark [16/8]) conditions. ZT0 corresponds to the beginning of the light period on Day 15. Shade treatment started on Day 15 at ZT3 by adding FR light to decrease the R/FR ratio. Each bar plot represents data from four biological replicates. Per replicate, 15 and 20 entire rosettes of Col-0 and nced3nced5 plants, respectively, were harvested and frozen in liquid nitrogen. D, ABA concentration in rosettes of Col-0 and pif4pif5pif7 triple plants in high R/FR (blue) versus low R/FR (red) conditions at 2 h (ZT5) after start of treatment. Plants were grown for 14 d in standard LD (16-h light, 8-h dark [16/8]) conditions. ZT0 corresponds to the beginning of the light period on Day 15. Shade treatment started on Day 15 at ZT3 by adding FR light to decrease the R/FR ratio. Each bar plot represents data from four biological replicates. Per replicate, 15 entire rosettes were harvested and frozen in liquid nitrogen. E, Relative fold expression of NCED3 in Col-0 and pif4pif5pif7 from Leaves 1 and 2 in high R/FR (blue) versus LRFR (red) conditions. Gene expression values were calculated as fold induction relative to a sample in high R/FR conditions. Plants were grown for 14 d in standard LD (16-h light, 8-h dark [16/8]) conditions. ZT0 corresponds to the beginning of the light period on Day 15. Shade treatment started on Day 15 at ZT3 by adding FR light to decrease the R/FR ratio. At ZT5 (±2 h shade), entire Leaves 1 and 2 were separately pooled into three biological replicates and frozen in liquid nitrogen. F, Schematic representation of the NCED3 and HFR1 genes. Regions amplified by qPCR and relative positions of G- and PBE-boxes are depicted relative to the start codon. G, PIF4-HA binding to the NCED3 and HFR1 promoter regions. Input and immunoprecipitated DNA was extracted from 10-d-old PIF4::PIF4-HA(pif4-101) seedlings exposed to ±2 h of LRFR from ZT2 and quantified by qPCR. PIF4-HA enrichment is presented as IP/input. Bars represent the mean from three technical replicates. Statistical tests were performed for each locus separately. A–E and G, Error bars represent the 2-fold SE of mean estimates. Two-way ANOVAs followed by Tukey’s Honestly Significant Difference (HSD) test were performed and different letters were assigned to significantly different groups (P-value < 0.05).

