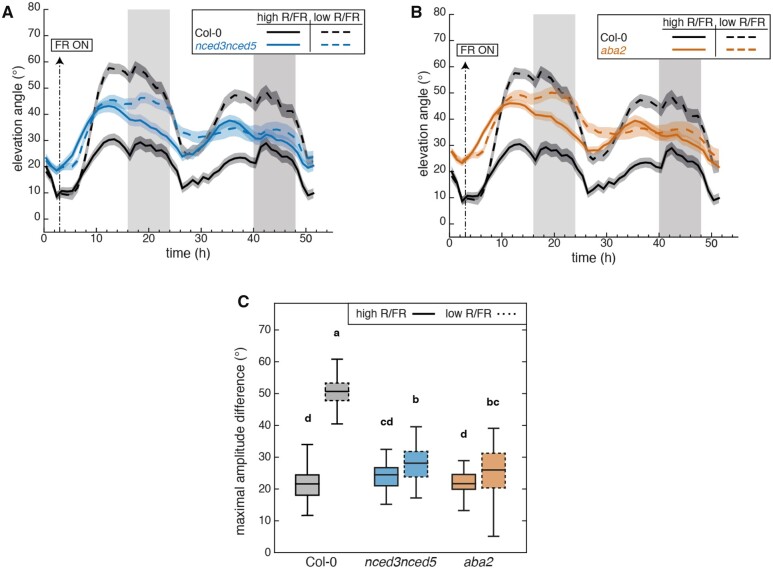
Figure 2.
Diel- and shade-induced hyponasties both require a functional ABA biosynthetic pathway. A, Leaf elevation angle of Leaves 1 and 2 in Col-0 (black) and nced3nced5 mutant (blue) plants in high R/FR (solid) versus low R/FR (dashed) conditions. Leaf elevation angles are mean values (n=44–58). B, Leaf elevation angle of Leaves 1 and 2 in Col-0 (black) and aba2 mutant (orange) plants in high R/FR (solid) versus low R/FR (dashed) conditions. Leaf elevation angles are mean values (n=44–60). A and B, Plants were grown for 14 d in standard LD (16/8) conditions. Imaging started on Day 15 at ZT0 (t=0), plants were maintained in LD. Shade treatment started at ZT3 by adding FR light to decrease the R/FR ratio. Col-0 plants analyzed in (A) and (B) are same. Opaque bands around mean lines represent the 95% confidence interval of mean estimates. Vertical gray bars represent night periods. C, Boxplots representing the amplitude of leaf movement between maximum and minimum leaf elevation angles over the time period from t=3 to t=16 and computed for each individual leaf analyzed in (A) and (B). The central mark indicates the median; the bottom and top edges of the box indicate the 25th and 75th percentiles, respectively; and the whiskers extend to the most extreme data points. Solid and dashed plots represent data from high R/FR and low R/FR conditions, respectively. Two-way ANOVA followed by Tukey’s HSD test were performed and different letters were assigned to significantly different groups (P-value < 0.05).

