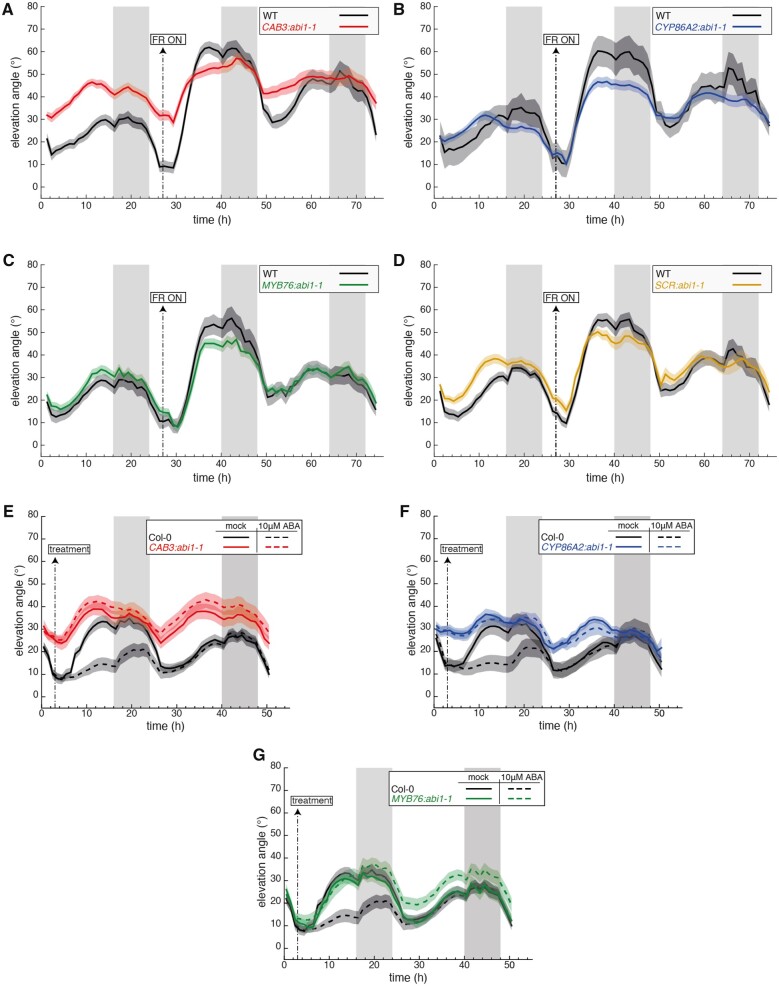
Figure 6.
ABA signaling in multiple tissues modulates the hyponastic response. A–D, Leaf elevation angle of Leaves 1 and 2 in Col-0 (A-D, black), CAB3::abi1-1 mutant (A, red, line #MT36-11), pCYP86A2::abi1-1 mutant (B, blue, line #MT39-03), pMYB76::abi1-1 mutant (C, green, line #MT41-13), pSCR::abi1-1 mutant (D, orange, line #MT37-24) plants in high R/FR then low R/FR conditions. Shade treatment started on Day 16 at t=27 (ZT3) by adding FR light to decrease the R/FR ratio. Leaf elevation angles are mean values (A, n=18–24; B, n=6–30; C, n=16–28; D, n=16–26). E–G, Leaf elevation angle of Leaves 1 and 2 in Col-0 (E-G, black), pCAB3::abi1-1 mutant (E, red, line #MT36-11), pCYP86A2::abi1-1 mutant (F, blue, line #MT39-03), pMYB76::abi1-1 mutant (G, green, line #MT41-13) plants sprayed with mock solution (solid lines) or 10 μM ABA (dashed lines). At ZT3 on Day 15 (t=3) mock or ABA solutions were sprayed on the entire rosette (adaxial side). Col-0 plants analyzed in (E) and (G) are same. Leaf elevation angles are mean values (E, n=26–28; F, n=25–28; G, n=21–27). A–G, Plants were grown for 14 d in standard LD (16/8) conditions. Imaging started on Day 15 at ZT0 (t=0), plants were maintained in LD. Opaque bands around mean lines represent the 95% confidence interval of mean estimates. Vertical gray bars represent night periods.

