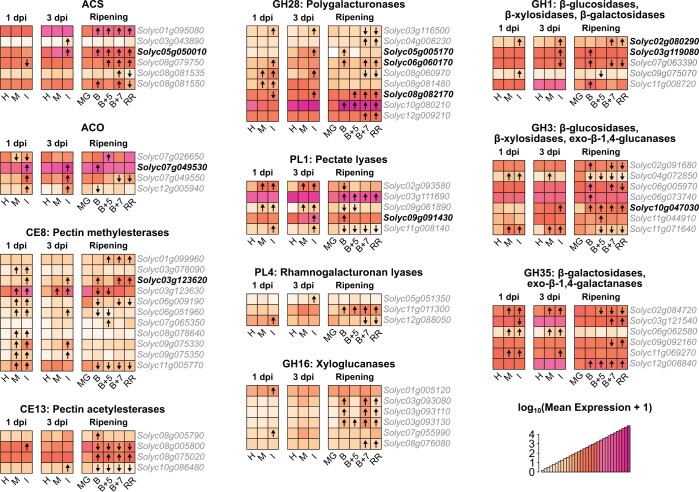
Figure 2.
Expression patterns of ethylene biosynthesis and CWDE genes in B. cinerea-inoculated unripe fruit and healthy fruit ripening. Heatmaps of normalized expression values in healthy, mock-inoculated, and B. cinerea-inoculated MG fruit at 1 and 3 dpi, as well as healthy ripening obtained from the fruitENCODE (Lü et al., 2018). Normalized expression values have undergone a log10(mean expression + 1) transformation. Arrows within heatmap tiles indicate statistically significant (Padj < 0.05) upregulated or downregulated genes when compared to expression values in healthy MG fruit at that time point. Bold type font indicates genes that were upregulated by both B. cinerea inoculation and ripening. H, healthy; B, Breaker.

