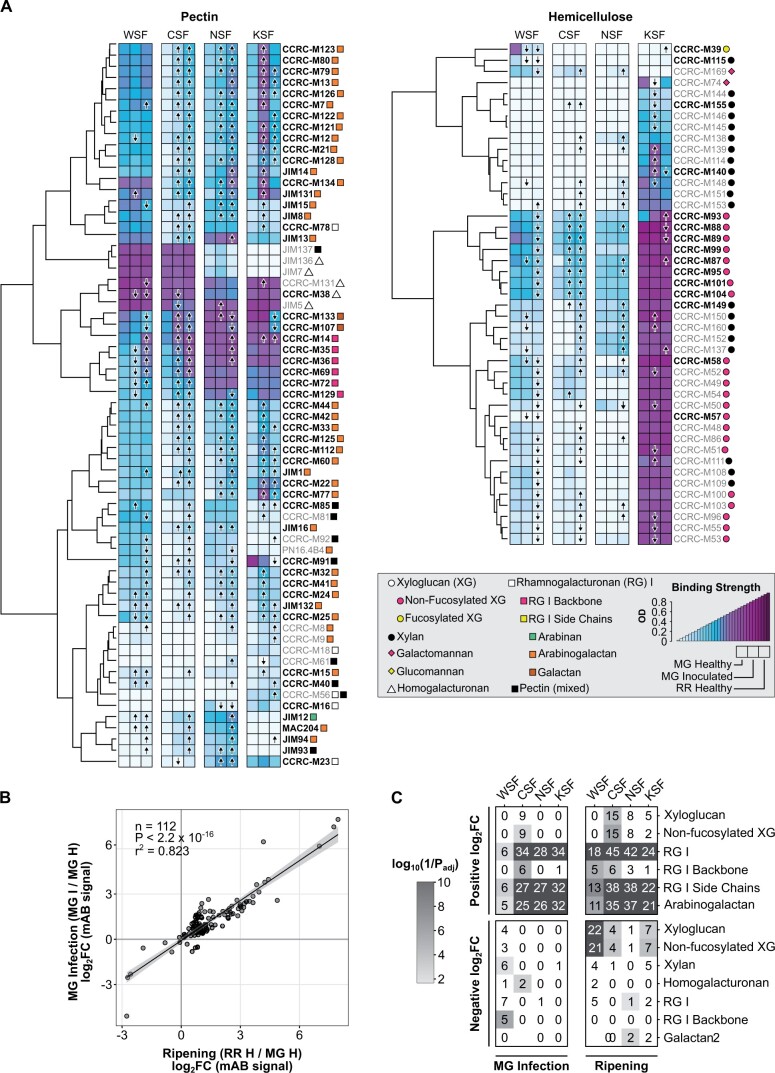
Figure 3.
Glycomics profiling of B. cinerea-inoculated unripe fruit. A, Heatmaps of binding strength of polysaccharide-binding mABs measured as optical density in healthy MG (H), B. cinerea-inoculated MG fruit (MG I), and healthy RR (H) at 3 dpi or dph. mAB codes are given to the right of each heatmap row, with the recognized classes of cell wall polysaccharides indicated by colored shapes according to the given key. mAB listed in bold type are those included in the scatterplot in (B). Arrows within heatmap tiles indicate statistically significant (Padj < 0.05) increasing or decreasing antibody strength when compared via t test to values in healthy MG fruit (n = 6). B, Scatterplot and linear regression model of log2 fold change (log2FC) values of mAB signals in MG inoculation (MG I/MG H) and ripening (RR H/MG H) comparisons. C, Enrichment of polysaccharide classes with statistically significant positive or negative log2FCs in each cell wall fraction for the ripening and MG inoculation comparisons. Numbers within each tile indicate the number of mABs with a statistically significant log2FC in that respective fraction and polysaccharide class.

