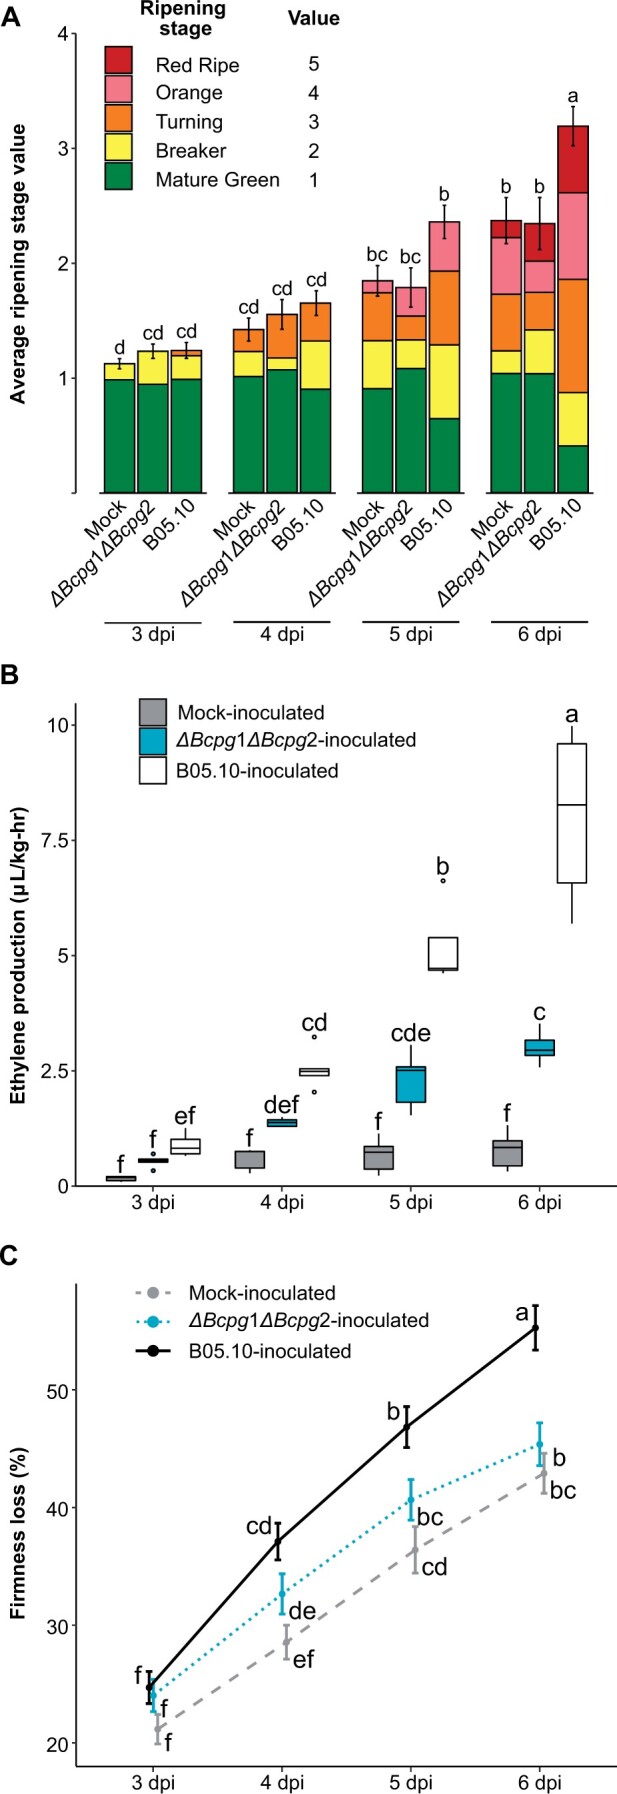
Figure 5.

Ripening progression of unripe fruit inoculated with the B. cinerea ΔBcpg1ΔBcpg2 double mutant. A, Average ripening stage value as assessed by color in mock-inoculated, B05.10-inoculated, and ΔBcpg1ΔBcpg2-inoculated MG fruit (n = 43–55) from 3 to 6 dpi. Colored blocks within each column represent the proportion of fruit at that respective stage. B, Production of ethylene in mock-inoculated, B05.10-inoculated, and ΔBcpg1ΔBcpg2-inoculated MG fruit (n = 35–37). C, Firmness loss in mock-inoculated, B05.10-inoculated, and ΔBcpg1ΔBcpg2-inoculated MG fruit measured as a percentage of initial firmness at 0 dpi (n = 70–216). Error bars in all panels correspond to the standard error of the mean. Letters in (A–C) indicate the statistical differences (P < 0.05) between each treatment across all dpi as calculated by ANOVA and Tukey’s HSD test.
